S&P 500 Q1 2025 Upside Potential Analysis
解锁更多功能
登录后即可使用AI智能分析、深度投研报告等高级功能
关于我们:Ginlix AI 是由真实数据驱动的 AI 投资助手,将先进的人工智能与专业金融数据库相结合,提供可验证的、基于事实的答案。请使用下方的聊天框提出任何金融问题。
The S&P 500 index has demonstrated remarkable resilience in 2025, delivering its third consecutive year of double-digit gains. As of January 12, 2026, the index trades at
| Moving Average | Current Value | Signal | Price Position |
|---|---|---|---|
| MA 20 | 6,878.19 | Bullish | Price above MA |
| MA 50 | 6,819.94 | Bullish | Price above MA |
| MA 200 | N/A* | Bullish | Price above MA |
Note: MA200 data incomplete due to lookback period
The
- Currently positioned in the neutral-to-overbought territory(below 70 threshold)
- Indicates strong but not extreme momentum
- No immediate divergence signals detected [0][2]
- MACD Line: 38.42
- Signal Line: 32.23
- Histogram: Positive (6.19)
- Signal: BULLISH— MACD trading above signal line with expanding histogram confirms strong upward momentum [0][2]
| Band | Price Level |
|---|---|
| Upper Band | 7,012.00 |
| Middle (MA20) | 6,878.19 |
| Lower Band | 6,744.39 |
The index is trading in the
┌─────────────────────────────────────────────────────────────┐
│                    S&P 500 PRICE MATRIX                      │
├─────────────────────────────────────────────────────────────┤
│  RESISTANCE LEVELS:                                         │
│    R1 (Psychological):  7,000.00  ████████████████████████  │
│    R2:                  7,062.18                            │
│    R3 (All-time High):  6,986.33                            │
├─────────────────────────────────────────────────────────────┤
│  CURRENT PRICE:         6,977.26                             │
├─────────────────────────────────────────────────────────────┤
│  SUPPORT LEVELS:                                            │
│    S1:                   6,720.43                            │
│    S2 (61.8% Fib):       6,863.55                            │
│    S3 (50% Fib):         6,825.62                            │
│    S4 (38.2% Fib):       6,787.70                            │
└─────────────────────────────────────────────────────────────┘
The technology sector has been the primary catalyst for S&P 500 gains, with
- AI Capital Spending Surge: Unanticipated acceleration in AI infrastructure investments has provided unexpected economic tailwinds [3]
- Cloud Computing Expansion: Enterprise cloud adoption continues to accelerate across sectors
- Productivity Gains: Similar to the late 1990s, AI adoption is driving productivity improvements that support earnings growth [4]
The Federal Reserve has implemented
- Lower Borrowing Costs: Enhanced corporate profitability through reduced debt servicing costs
- Valuation Support: Lower discount rates enhance present value of future earnings
- Consumer Spending: Improved disposable income supports consumption
S&P 500 earnings projections remain robust:
| Period | Earnings Growth | Source |
|---|---|---|
| 2025 (Full Year) | +13% | LSEG [4] |
| 2026 (Projected) | +15%+ | Analyst Consensus [4] |
The passage of the
- M&A Activity Expected Surge: Following two years of 20%+ returns, M&A activity correlation (+68% from 1998-2024) suggests increased deal activity in 2025 [5]
- Industrial Production Strengthening: Corporate restocking cycles remain robust, with companies continuing to replenish inventories [5]
Central banks worldwide are in
| Sector | Daily Change | Status |
|---|---|---|
| Consumer Defensive | +1.88% | 🟢 Leading |
| Technology | +0.89% | 🟢 Strong |
| Financial Services | +0.67% | 🟢 Improving |
| Industrials | +0.57% | 🟢 Rising |
| Utilities | +0.45% | 🟢 Stable |
| Basic Materials | +0.28% | 🟢 Flat |
| Energy | +0.05% | 🟢 Neutral |
| Consumer Cyclical | +0.02% | 🟢 Flat |
| Communication Services | +0.02% | 🟢 Stable |
| Healthcare | -0.94% | 🔴 Underperforming |
| Real Estate | -1.53% | 🔴 Weakest |
| Indicator | Current Reading | Action Signal | Monitor For |
|---|---|---|---|
RSI (14) |
69.63 | Neutral → Overbought >70 | Potential short-term pullback if >70 |
MACD |
Above Signal Line | Bullish | Cross below signal line |
Price vs MA50 |
Above | Bullish | Sustained break below |
Volume |
Average ↑ | Confirms trend | Volume dry-up on advances |
Bollinger Band Position |
Upper half | Strong | Touch upper band with rejection |
- VIX Index: Monitor for spikes above 20 indicating尾部风险增加
- Put/Call Ratio: Extreme readings (>1.5) may signal inflection points
- Advance/Decline Line: Breadth deterioration could signal warning
- New Highs/New Lows: Divergences between price and new highs
| Signal | Threshold | Implication |
|---|---|---|
| RSI > 70 for 3+ days | Overbought | Potential correction |
| MACD Death Cross | Signal line crossover | Trend change risk |
| Volume Decline on Up Days | <80% of average | Weak conviction |
| Support Break (MA50) | Close below | Trend in question |
- Entry Points: Monitor pullbacks to MA20 (6,878) or 50% Fibonacci level (6,826)
- Stop Losses: Place below 6,720 (S1 support) or MA50 break
- Take Profits: Target 7,000 psychological level, then 7,062
- Position Sizing: Maintain core exposure; add on significant pullbacks
- Diversification: Consider rotating toward sector breadth (Financials, Industrials)
- Risk Management: Use trailing stops or protective puts for portfolio protection
| Catalyst | Timing | Potential Impact |
|---|---|---|
| Q4 2025 Earnings | January-February | Positive if >13% growth |
| Fed Policy Statement | Ongoing | Rate cut expectations |
| AI Developments | Continuous | Sector leadership |
| Geopolitical Events | Uncertain | Volatility spike risk |
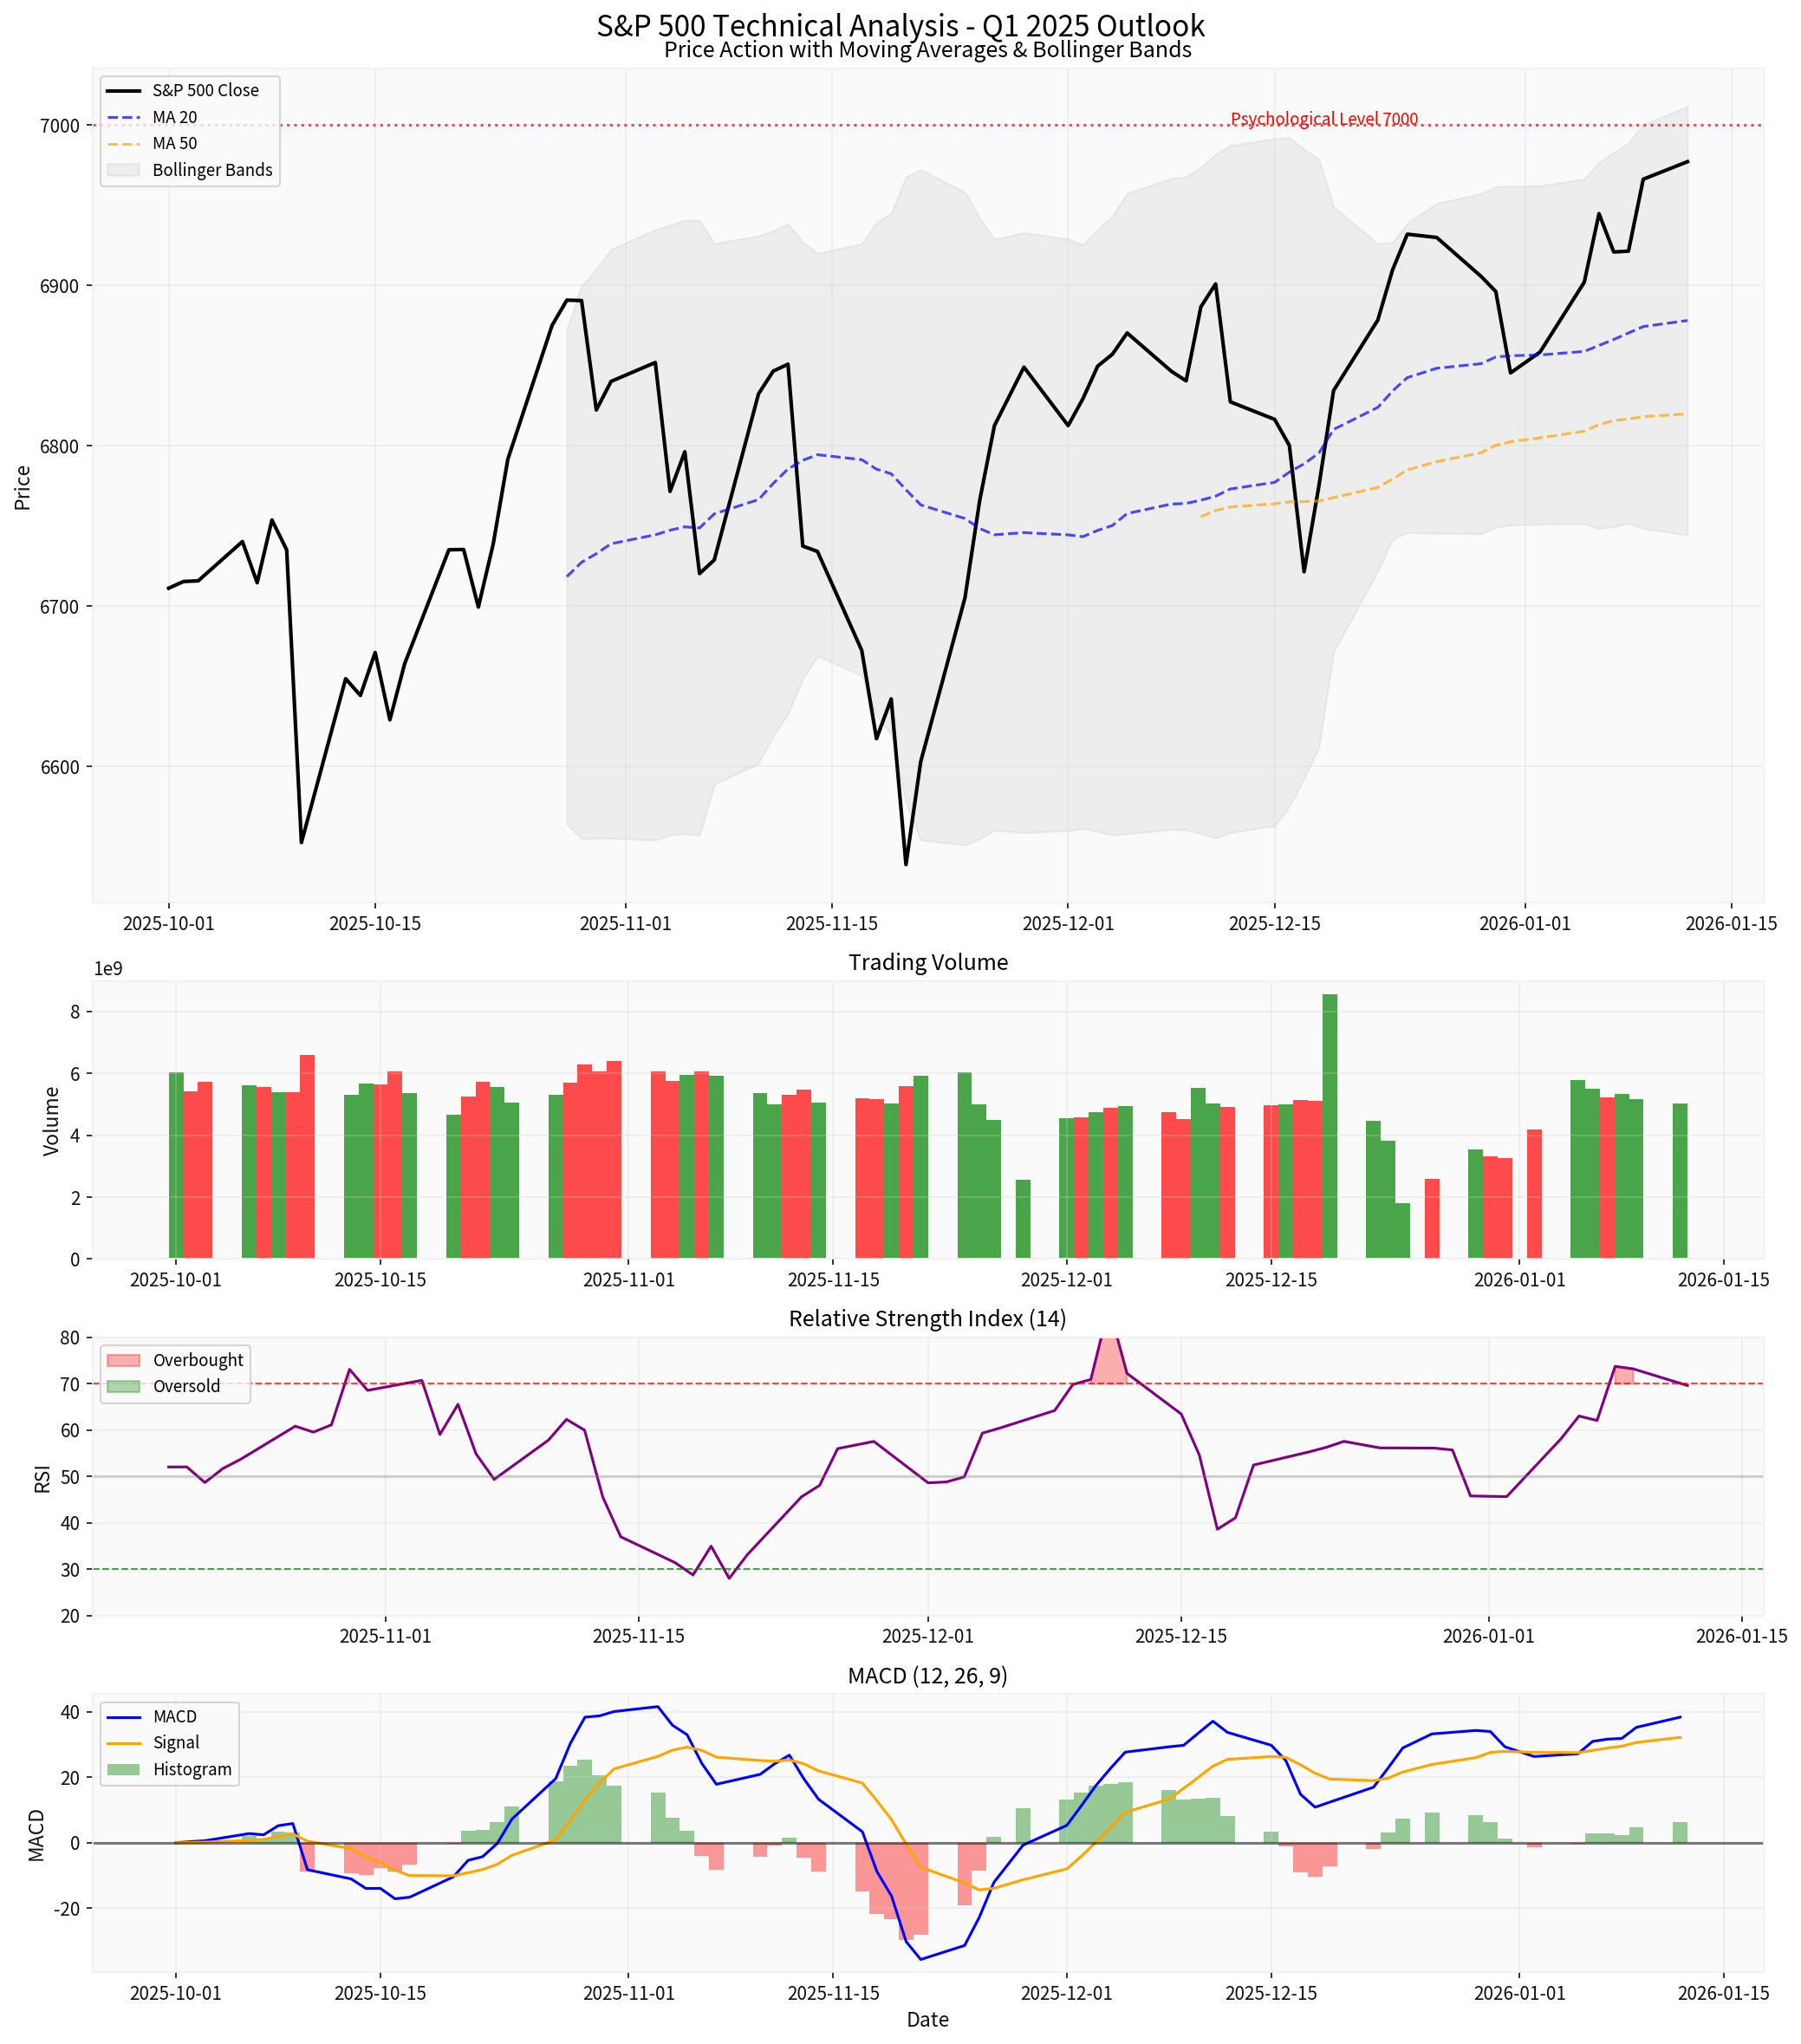
- Price action shows sustained uptrend with higher highs and higher lows
- MA20 and MA50 act as dynamic support levels
- RSI approaching overbought territory but not yet signaling reversal
- MACD histogram expansion confirms bullish momentum
| Target | Probability | Trigger |
|---|---|---|
| 7,000 | High | Sustained momentum, positive catalysts |
| 7,200 | Moderate | Strong earnings, Fed support |
| 7,400 | Lower | Broad earnings acceleration, AI breakthrough |
| Level | Trigger |
|---|---|
| 6,863 (61.8% Fib) | Normal correction |
| 6,720 (S1) | Moderate pullback |
| 6,500 | Technical breakdown |
The S&P 500 demonstrates a
✅
- Price above all key moving averages
- MACD in bullish configuration
- Strong sector breadth (7 of 11 sectors positive)
- Robust earnings growth expectations
⚠️
- RSI approaching overbought territory
- Proximity to psychological 7,000 level
- Potential for short-term consolidation
[0] Market Data - S&P 500 Index (2025-10-01 to 2026-01-13)
[1] Investing.com - S&P 500 Technical Analysis (https://www.investing.com/indices/us-spx-500-technical)
[2] SPDR S&P 500 ETF (SPY) Technical Analysis - SPDR S&P 500 ETF Trust
[3] RBC Wealth Management - U.S. equity returns in 2025: Record-breaking resilience (https://www.rbcwealthmanagement.com/en-us/insights/us-equity-returns-in-2025-record-breaking-resilience)
[4] Reuters - AI spending, strong corporate profits, Fed rate cuts seen as key to 2026 US stock market (https://www.reuters.com/business/ai-spending-strong-corporate-profits-fed-rate-cuts-seen-key-2026-stock-market-2025-12-24/)
[5] Neuberger Berman - Equity Market Outlook 1Q 2025 (https://www.nb.com/en/global/equity-market-outlook/equity-market-outlook-1q2025)
数据基于历史,不代表未来趋势;仅供投资者参考,不构成投资建议
关于我们:Ginlix AI 是由真实数据驱动的 AI 投资助手,将先进的人工智能与专业金融数据库相结合,提供可验证的、基于事实的答案。请使用下方的聊天框提出任何金融问题。