Murphy USA (MUSA): Fuel Margin Sustainability and Retail Fuel Sector Valuation Analysis
解锁更多功能
登录后即可使用AI智能分析、深度投研报告等高级功能
关于我们:Ginlix AI 是由真实数据驱动的 AI 投资助手,将先进的人工智能与专业金融数据库相结合,提供可验证的、基于事实的答案。请使用下方的聊天框提出任何金融问题。
相关个股
Murphy USA Inc. (MUSA) has demonstrated resilient fuel margin performance despite a challenging environment characterized by moderating crude oil prices and shifting consumer behavior. Wells Fargo’s price target upgrade to $410 reflects confidence in the company’s ability to maintain profitability in an evolving energy market. This analysis examines the sustainability of MUSA’s fuel margins and the broader implications for retail fuel sector valuations.
Murphy USA operates 1,772 retail fuel stations across 27 states, primarily concentrated in the Southeast, Midwest, and Southwest regions of the United States[0]. The company’s business model centers on high-volume, low-price fuel retailing, often positioned adjacent to Walmart stores to leverage high-traffic retail locations.
| Metric | Value |
|---|---|
| Current Price | $431.70 |
| Market Cap | $8.33B |
| P/E Ratio (TTM) | 17.43x |
| ROE | 68.49% |
| 52-Week Range | $345.23 - $523.09 |
| YTD Performance | +6.51% |
The stock currently trades at $431.70, which is above the Wells Fargo price target of $410 mentioned in the query, and aligns with the analyst consensus target of $432.50[0]. Notably, Wells Fargo actually downgraded MUSA from Overweight to Equal Weight in October 2025, suggesting the initial upgrade thesis may have largely played out[0].
According to Murphy USA’s most recent 10-Q filing (Q3 2025), total fuel contribution was
- Lower crude oil prices:WTI averaged $66/barrel in Q3 2025 vs. $76/barrel in Q3 2024
- Retail fuel margin compression:Retail fuel margin dollars decreased 10.4% YoY
- Partially offset by volume growth:Retail fuel volumes increased 1.2% during the quarter
The company’s low-cost operating model enables it to maintain competitive retail pricing while protecting margins. Murphy USA’s lean store footprint and optimized operations (often without full convenience store buildouts) allow for lower operating costs per gallon compared to competitors[0].
A notable tailwind emerged from RINs pricing, which averaged $1.07 per RIN in Q3 2025 compared to $0.60 per RIN in Q3 2024—a 78% increase[0]. This revenue stream, included in “Other operating revenues,” provides margin support beyond traditional fuel spreads.
While fuel margins compressed, merchandise contribution increased, helping offset fuel profitability declines. Merchandise sales grew 3.7% YoY in Q3 2025, demonstrating the company’s diversification strategy[0].
According to the U.S. Energy Information Administration (EIA) Short-Term Energy Outlook (January 2026), several factors will influence retail fuel margins going forward[1]:
| Year | Retail Gasoline Price ($/gal) | Key Driver |
|---|---|---|
| 2025 | $3.10 | Declining crude prices |
| 2026E | $2.92 | Lower crude + rising refinery margins |
| 2027E | $2.95 | Slight crude increase, stable margins |
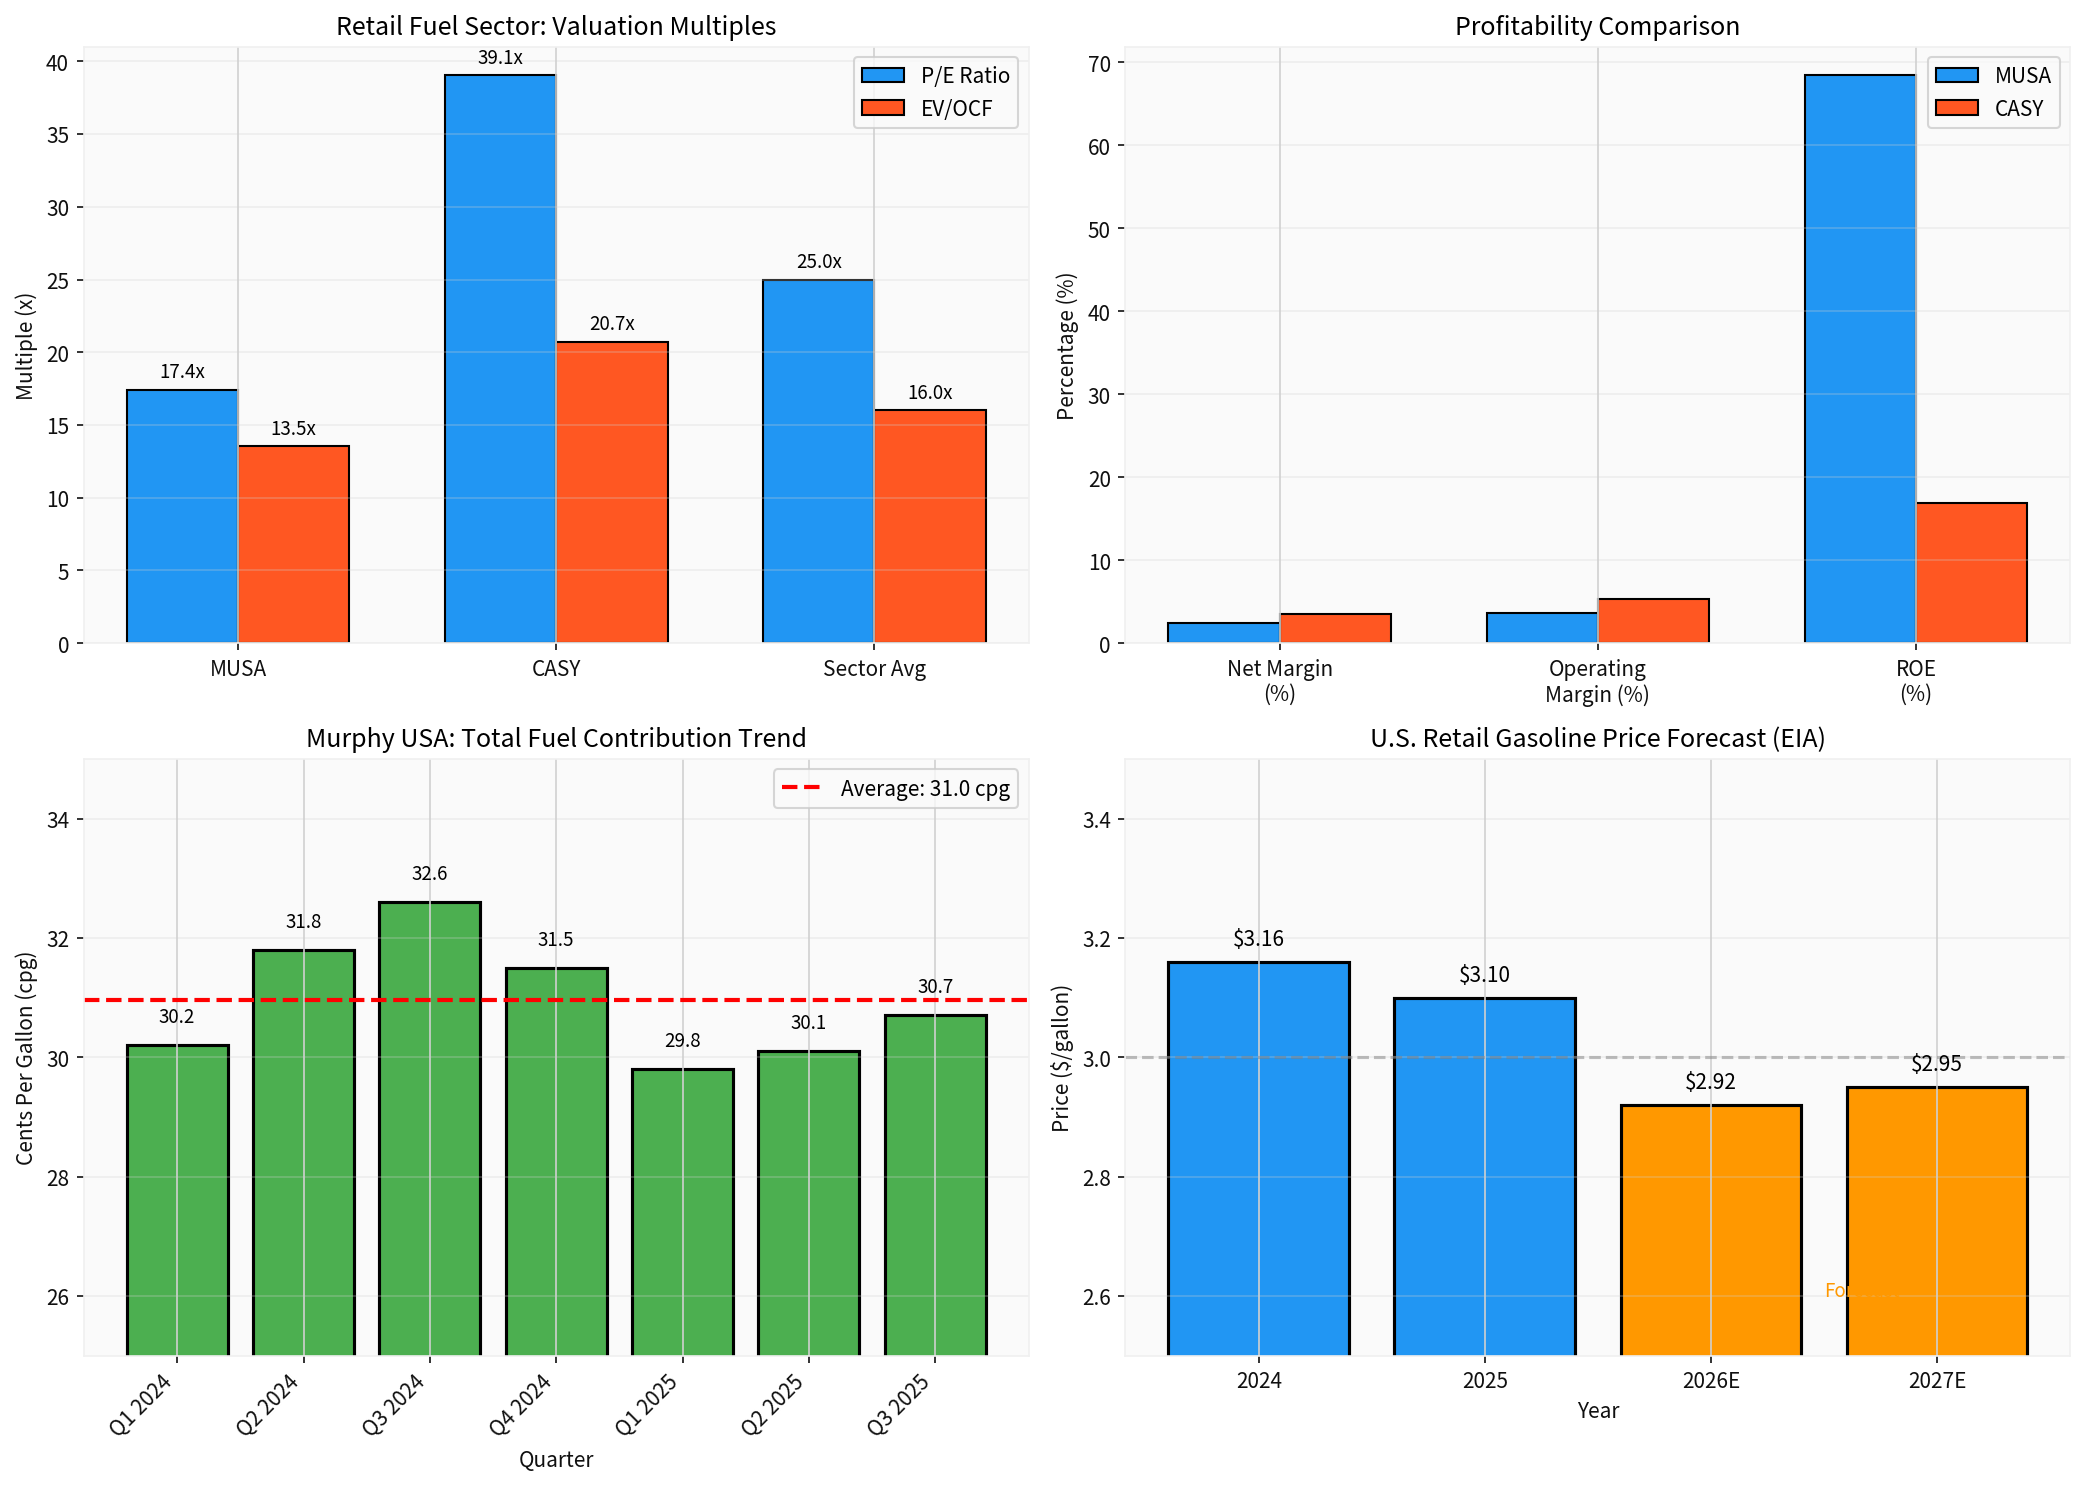
| Metric | Murphy USA (MUSA) | Casey’s (CASY) | Sector Implications |
|---|---|---|---|
| P/E Ratio | 17.43x | 39.06x | MUSA trades at 55% discount |
| EV/OCF | 13.54x | 20.74x | Strong cash generation |
| Net Margin | 2.44% | 3.58% | Fuel-heavy mix compresses margins |
| ROE | 68.49% | 16.89% | Aggressive capital efficiency |
| Market Cap | $8.33B | $23.67B | Scale difference |
- MUSA operates primarily fuel-focused stations with limited convenience store offerings
- Casey’s has invested heavily in prepared food and dispensed beverages, which generate higher margins
- This explains Casey’s higher net margin (3.58%) vs. MUSA (2.44%)[0]
- Casey’s receives a “BUY” consensus with 62.5% of analysts bullish
- MUSA holds a “HOLD” consensus with only 27.3% buy ratings[0]
- Casey’s 1-year return (+58.69%) significantly outperformed MUSA (-11.17%)[0]
- MUSA’s financial analysis indicates “high risk” debt classification[0]
- Long-term debt increased to $2.22B (Sep 2025) from $1.83B (Dec 2024)[0]
- The company has been aggressive with share repurchases ($583M YTD 2025), funded partially through debt
Based on the DCF analysis, MUSA appears significantly undervalued relative to intrinsic value estimates[0]:
| DCF Scenario | Fair Value | vs. Current Price |
|---|---|---|
| Conservative | $1,908 | +342% upside |
| Base Case | $2,550 | +491% upside |
| Optimistic | $5,606 | +1,199% upside |
-
Refinery Capacity Constraints:West Coast refinery closures will tighten gasoline supply, potentially supporting crack spreads and retail margins through 2026-2027[1]
-
Low-Cost Operator Advantage:Murphy USA’s efficient operating model allows it to maintain profitability even during margin compression periods
-
RINs Revenue Buffer:The Renewable Fuel Standard continues to provide supplementary revenue, though this remains subject to regulatory uncertainty
-
Store Format Upgrades:The company is transitioning kiosk locations to larger-format MUSA 1400 and MUSA 2800 stores, which support higher merchandise sales and improved unit economics[1]
-
Fuel Margin Normalization:Q3 2025 fuel contribution (30.7 cpg) is already below the Q3 2024 level (32.6 cpg), indicating margin compression is underway[0]
-
EV Transition Risk:Long-term structural decline in gasoline demand as electric vehicle adoption accelerates represents an existential threat to pure-play fuel retailers
-
Debt Load Concerns:$2.2B in long-term debt with aggressive share buybacks limits financial flexibility during downturns[0]
-
Competitive Pressure:Major competitors like Alimentation Couche-Tard (Circle K) and Casey’s continue expanding, intensifying competition in MUSA’s core markets[2]
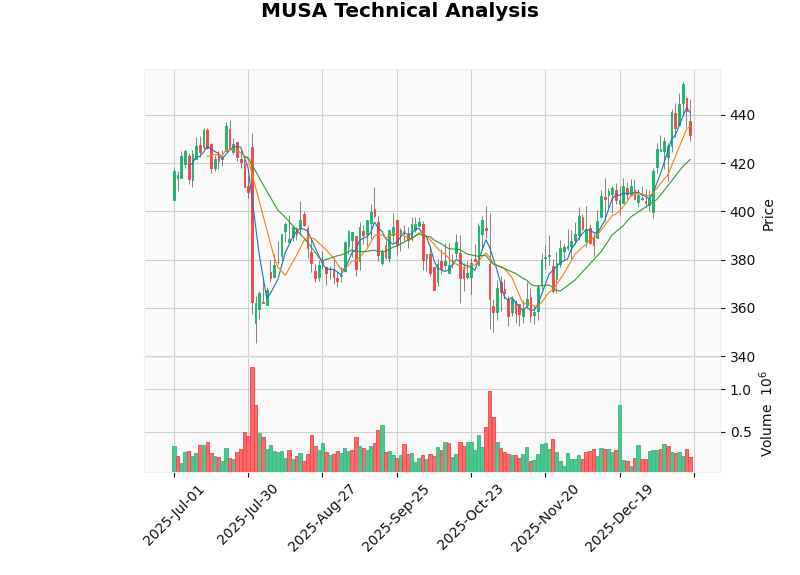
The technical picture for MUSA shows a
| Technical Indicator | Value/Signal |
|---|---|
| Trend | Sideways |
| Support Level | $421.47 |
| Resistance Level | $438.17 |
| MACD | Bullish (no cross) |
| KDJ | Bearish |
| RSI | Normal range |
| Beta | 0.40 (low volatility) |
- Lower growth expectations
- Higher leverage
- Greater exposure to fuel margin volatility
-
Valuation Dispersion:The wide valuation gap between pure-play fuel retailers (MUSA) and diversified convenience store operators (CASY) will likely persist, as investors reward food-focused business models with higher multiples
-
Margin Sustainability:The EIA’s forecast for rising refinery margins in 2026 provides a constructive backdrop for fuel retailer profitability, though this is already partially reflected in stock prices
-
M&A Activity:Sector consolidation may accelerate as larger players like Alimentation Couche-Tard seek scale advantages. MUSA’s regional focus and strategic locations could make it an attractive acquisition target[2]
-
EV Transition Overhang:Long-term valuation multiples for the sector will remain capped by structural concerns about gasoline demand decline, limiting upside potential for pure fuel retailers
Murphy USA’s fuel margins face near-term pressure from normalizing crude oil prices and competitive dynamics, with Q3 2025 total fuel contribution (30.7 cpg) declining from prior-year levels. However, the company’s low-cost operating model, diversified revenue streams (merchandise, RINs), and favorable macroeconomic factors (rising refinery margins in 2026) support margin sustainability at historically reasonable levels.
For retail fuel sector valuations, investors should differentiate between:
- Pure-play fuel retailers(MUSA): Trading at discounted multiples, appropriate for value-oriented investors willing to accept leverage risk and limited growth
- Diversified convenience operators(CASY): Commanding premium valuations for food-service exposure and stronger growth profiles
The Wells Fargo price target of $410 appears conservative relative to MUSA’s current trading price of $431.70, suggesting the upgrade thesis has largely materialized. With analysts now holding a consensus “Hold” rating, the risk-reward for new positions appears balanced at current levels.
[0] Gilin API Data - Financial data, company overview, SEC filings, and technical analysis for MUSA and CASY
[1] U.S. Energy Information Administration - “Short-Term Energy Outlook,” January 2026 (https://www.eia.gov/outlooks/steo/pdf/steo_full.pdf)
[2] NACS - “Couche-Tard Profits Up As Merchandise Sales Increase,” November 2025 (https://www.convenience.org/Media/Daily/LastYear)
数据基于历史,不代表未来趋势;仅供投资者参考,不构成投资建议
关于我们:Ginlix AI 是由真实数据驱动的 AI 投资助手,将先进的人工智能与专业金融数据库相结合,提供可验证的、基于事实的答案。请使用下方的聊天框提出任何金融问题。