Comprehensive Guide to Form 13F Filing Analysis for Institutional Investment Trends
解锁更多功能
登录后即可使用AI智能分析、深度投研报告等高级功能
关于我们:Ginlix AI 是由真实数据驱动的 AI 投资助手,将先进的人工智能与专业金融数据库相结合,提供可验证的、基于事实的答案。请使用下方的聊天框提出任何金融问题。
相关个股
Now I have comprehensive information to provide you with a detailed guide on analyzing Form 13F filings. Based on my research, here’s a complete framework for effectively using Form 13F data to identify institutional investment trends and improve your portfolio decisions.
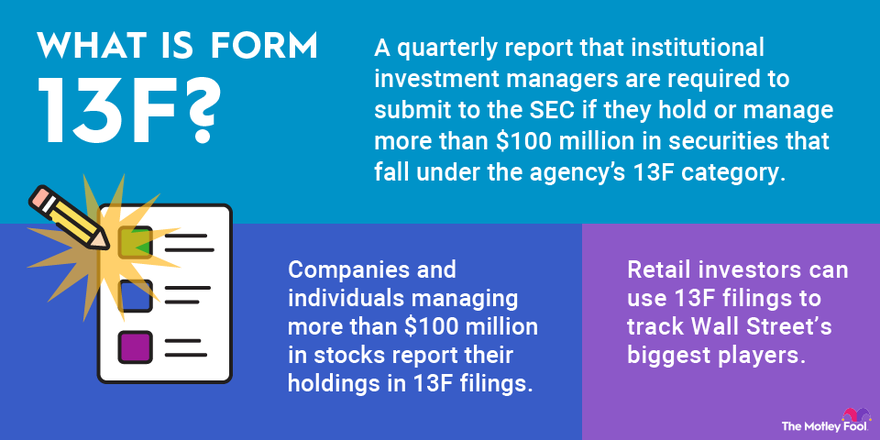
Form 13F is a quarterly report required by the SEC for institutional investment managers who manage
The filings are publicly accessible through the SEC’s EDGAR database and typically include:
- Holdings information: Complete lists of equity securities
- Position details: Number of shares held and market value
- Changes from prior quarters: New positions, exits, and significant changes
- Filing dates: Quarterly submissions (45 days after quarter-end)
When analyzing any institutional investor’s 13F filing, focus on these critical elements [2]:
| Data Point | What It Reveals |
|---|---|
Top Holdings |
Core portfolio positions and concentration risk |
Sector Allocation |
Investment thesis and market outlook |
Position Changes |
Directional bets and tactical shifts |
New Positions |
Emerging opportunities or themes |
Eliminated Positions |
Sectors or stocks being de-risked |
Based on available data, Alley Investment Management Company LLC’s recent 13F filing reveals significant positions, with Microsoft Corporation (MSFT) representing approximately
- Focus on top-performing hedge fundsand well-known investors (e.g., Warren Buffett’s Berkshire Hathaway, Ray Dalio’s Bridgewater Associates, David Einhorn’s Greenlight Capital)
- Track sector-focused specialistsfor deeper industry insights
- Monitor activist investorsfor potential corporate governance changes
- Primary Source: SEC EDGAR database (official filings)
- Aggregated Platforms: Services like 13FPro, HedgeFollow, and Finviz provide consolidated views [2][3]
- API Access: Financial Modeling Prep and similar platforms offer programmatic access to 13F data
Calculate institutional ownership percentages to identify:
- High-concentration stocks: Potential crowding risk
- Underowned stocks: Potential alpha opportunities
- Ownership changes: Flow of institutional capital
Monitor how top managers shift sector allocations across quarters:
- Increasing sectors: Where “smart money” sees opportunity
- Decreasing sectors: Areas of concern or profit-taking
- New sector entries: Emerging investment themes
For each stock, analyze:
- New positions: First-time institutional buys
- Increased positions: Conviction adds
- Decreased positions: Partial profit-taking or concern
- Eliminated positions: Full exit signals
Use positive 13F flow as confirmation for mid-term trend entries. Only establish positions in stocks where institutions are adding to their holdings, using 13F data as a
Identify heavily owned stocks to avoid:
- High institutional ownership increases volatility risk
- Monitor for rapid position unwinding
- Consider liquidity implications in crowded names
Look for:
- Out-of-favor stockswith decreasing institutional ownership
- Quality stocksbeing discarded by generalist funds
- Specialist accumulationin overlooked sectors
Aggregate holdings across multiple institutional managers to create a
- Confirm multi-month trends
- Validate sector rotations
- Build “smart-money” baskets
Compare current holdings against:
- Prior quarter filings: Track trajectory
- Annual comparisons: Identify long-term trends
- Market cycles: Contextualize positioning
Combine 13F analysis with:
- Form 4 filings: Insider buying/selling activity
- Form 13D: Activist investor positions
- 13F-HR vs. 13F-HR/A: Distinguish initial from amended filings
- Set up alerts for major institutional investor filings
- Track significant position changes (typically >25% change thresholds)
- Monitor news flow for institutional activity
- Filing Calendar: SEC 13F filing deadline is 45 days after quarter-end
- Data Compilation: Aggregate filings from target institutions
- Change Analysis: Quantify net buying/selling by sector
- Thesis Testing: Validate or challenge existing investment thesis
| Strategy | 13F Application |
|---|---|
Core-Satellite |
Use top holdings as satellite candidates |
Factor Investing |
Identify factor exposure in institutional portfolios |
Risk Management |
Monitor crowding and concentration risk |
13F filings have a
- Only covers long equity positions
- Excludes short positions, derivatives, and non-equity assets
- Does not reflect current positioning(positions may have changed since filing)
- Different fund styles have varying time horizons
- Position size may reflect legacy holdingsrather than current conviction
- Filing requirements vary by institutional structure
| Resource | Use Case |
|---|---|
SEC EDGAR |
Primary source for official filings |
13FPro |
Portfolio change tracking and alerts [2] |
HedgeFollow |
Hedge fund holdings aggregation [3] |
Financial Modeling Prep API |
Programmatic data access |
Finviz |
Visualization and screening |
Form 13F filings provide an invaluable window into institutional investment behavior, enabling investors to identify trends, validate investment thesis, and make more informed portfolio decisions. By systematically analyzing these filings—tracking ownership changes, sector rotations, and position sizing—individual investors can gain insights into the strategies of the world’s most sophisticated money managers.
The key to successful 13F analysis lies in understanding its limitations (particularly the reporting lag), using aggregated data for trend identification, and integrating these insights as one component of a comprehensive investment process rather than as a standalone trading signal.
[1] U.S. Securities and Exchange Commission - Frequently Asked Questions About Form 13F (https://www.sec.gov/rules-regulations/staff-guidance/division-investment-management-frequently-asked-questions/frequently-asked-questions-about-form-13f)
[2] 13F Pro - Institutional Investment Manager Tracking Platform (https://www.13fpro.com/)
[3] HedgeFollow - Alley Investment Management Company LLC 13F Portfolio (https://hedgefollow.com/funds/Alley+Investment+Management+Company+LLC)
[4] Medium - “How to Use 13F Filings: Reading the Hidden Hand of Institutional Money” (https://medium.com/@trading.dude/how-to-use-13f-filings-reading-the-hidden-hand-of-institutional-money-a5b7d07a514e)
数据基于历史,不代表未来趋势;仅供投资者参考,不构成投资建议
关于我们:Ginlix AI 是由真实数据驱动的 AI 投资助手,将先进的人工智能与专业金融数据库相结合,提供可验证的、基于事实的答案。请使用下方的聊天框提出任何金融问题。