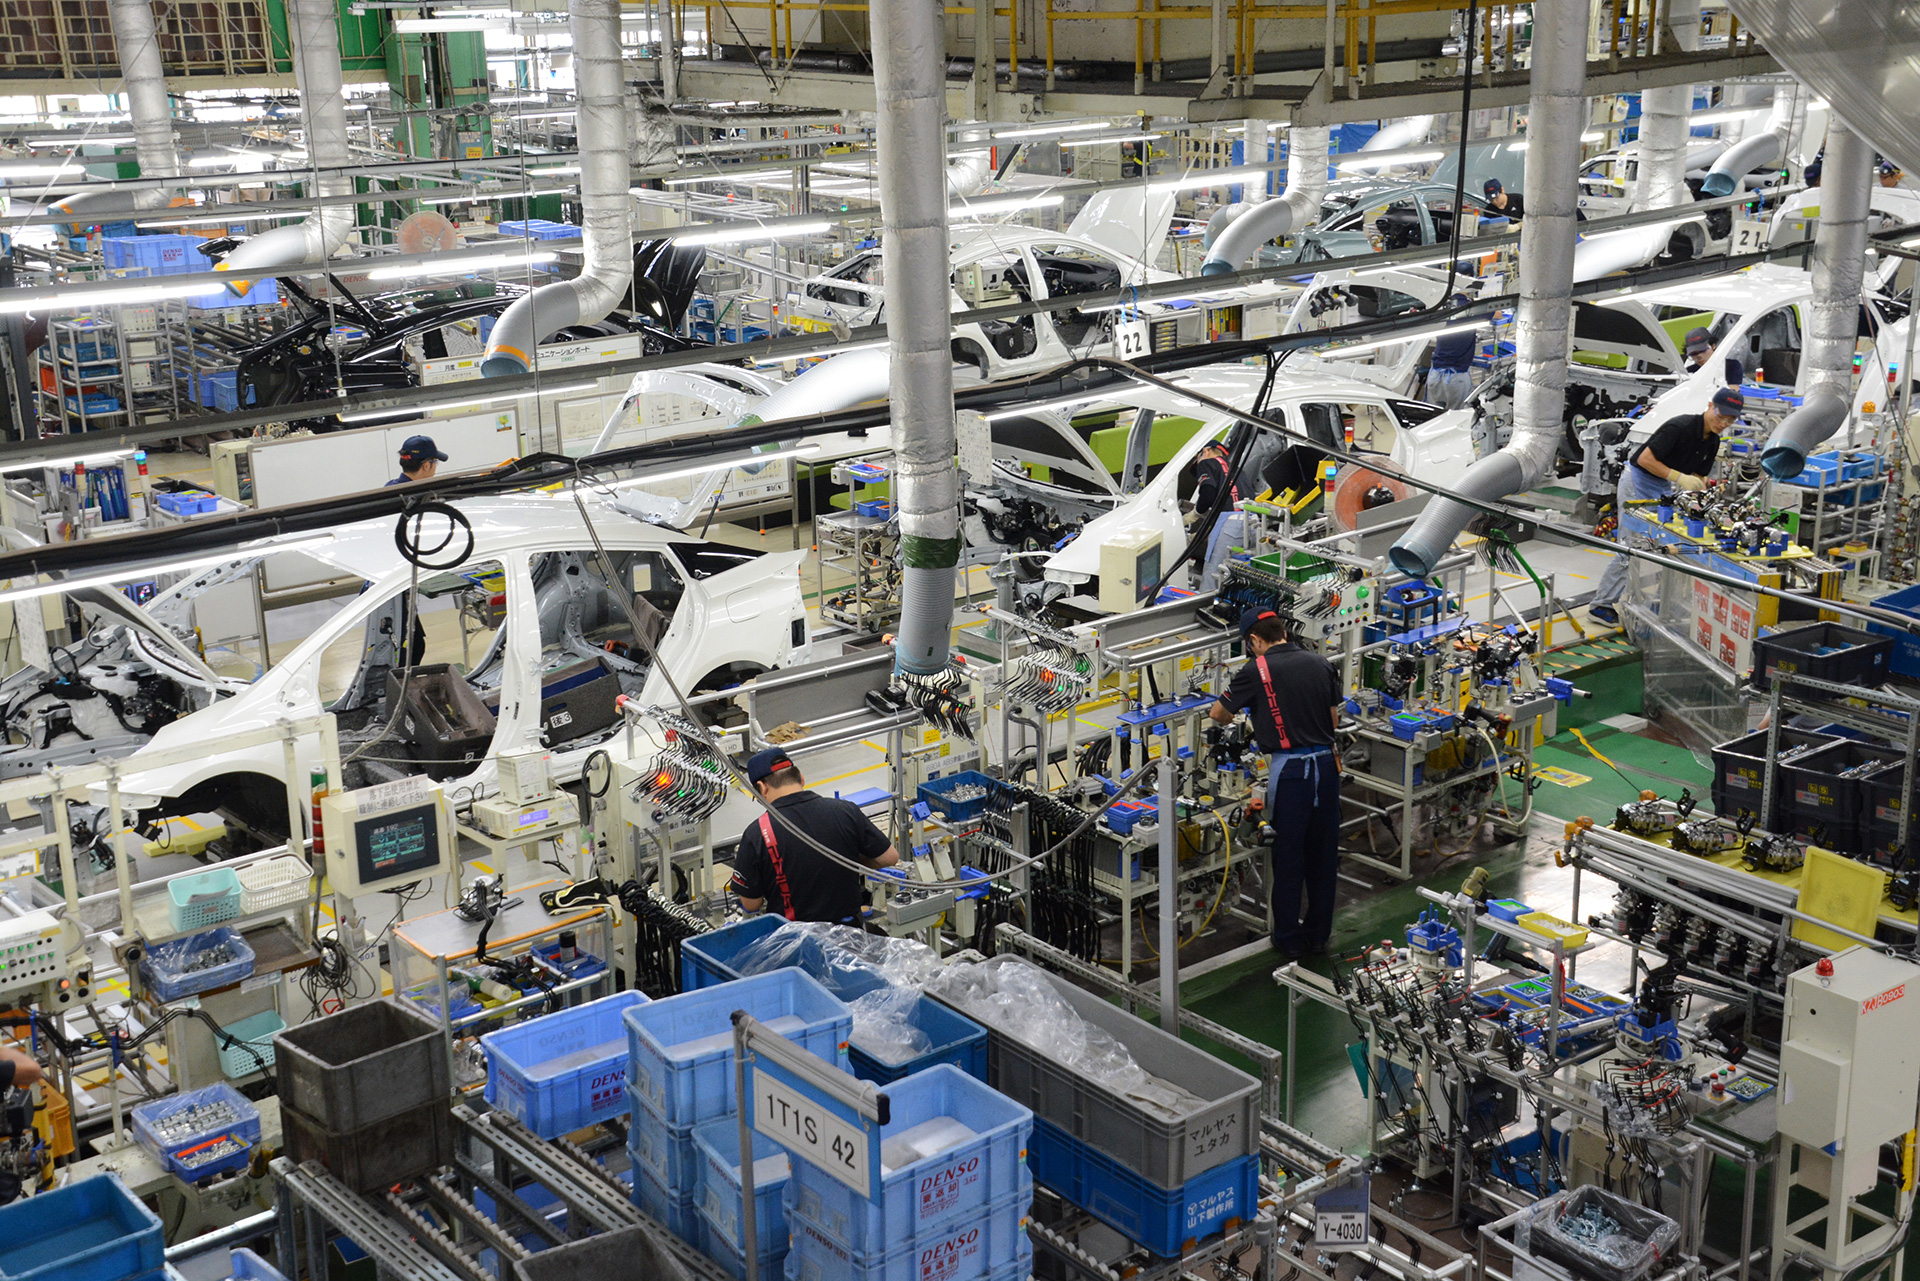
Toyota Motor Corporation (TM): Q3 FY2026 Analysis - Strategic Resilience Amid Tariff Headwinds
解锁更多功能
登录后即可使用AI智能分析、深度投研报告等高级功能
关于我们:Ginlix AI 是由真实数据驱动的 AI 投资助手,将先进的人工智能与专业金融数据库相结合,提供可验证的、基于事实的答案。请使用下方的聊天框提出任何金融问题。
相关个股
Toyota Motor Corporation has demonstrated remarkable resilience in the face of escalating global trade tensions, reporting Q3 FY2026 results that exceeded market expectations and prompting a raised full-year operating profit outlook despite an estimated
| Metric | Q3 FY2026 Result | vs. Prior Year | vs. Consensus |
|---|---|---|---|
Revenue |
¥13.46 billion (+8.6% YoY) | Strong growth | Exceeding estimates |
Operating Margin |
8.78% (TTM) | Stable | Above sector average |
EPS (Q2 FY26) |
$4.85 | — | +44.35% surprise |
Net Profit Margin |
9.38% (TTM) | Robust | Industry-leading |
Toyota’s Q3 results reflect sequential improvement following the implementation of targeted cost-reduction initiatives and sustained demand for its hybrid vehicle lineup globally[1].
Toyota has
| Manufacturer | Estimated Tariff Cost (FY2026) | Import Dependency (US Sales) | Operating Profit Impact |
|---|---|---|---|
Toyota |
$9.7 billion (1.45 trillion yen) | ~20% | Forecast Raised (+30% YoY) |
Hyundai |
~$3 billion (4.1 trillion won) | ~60% | -19.5% Decline |
Volkswagen |
Significant exposure | High | Under pressure |
Toyota’s tariff resilience stems from its
Toyota’s approach to managing tariff pressures has been multifaceted:
- Aggressive U.S. Manufacturing Expansion: A recent$912 million investmentadded252 new U.S. manufacturing jobs, with particular focus on hybrid production capacity[2]
- Cost Discipline: Successful implementation of cost-reduction programs across global operations
- Pricing Power Maintenance: Strategic decision to absorb rather than pass on tariff costs, preserving customer loyalty
- Diversified Geographic Revenue: Strong demand outside the U.S. offsetting domestic margin pressure
Toyota solidified its position as the
| Rank | Manufacturer | 2025 Global Sales |
|---|---|---|
| 1 | Toyota |
10.5 million |
| 2 | Volkswagen Group | 9.0 million |
| 3 | Hyundai Motor Group | 7.27 million |
Toyota’s U.S. market performance was particularly noteworthy, with
Toyota’s
| Vehicle Category | Share of Toyota/Lexus Sales (2025) |
|---|---|
Hybrids |
42% |
| Conventional Gasoline | 51% |
| Battery Electric Vehicles (BEVs) | <2% |
| Others | 5% |
This hybrid dominance has proven strategically valuable as:
- EV demand has plateauedglobally amid charging infrastructure constraints and affordability concerns[3]
- Hybrids offer immediate fuel efficiency benefitswithout range anxiety or charging infrastructure dependencies
- Toyota’s hybrid technology leadership( Prius, RAV4 Hybrid) provides sustainable competitive advantages
The company’s 47% electrified vehicle sales penetration in the U.S. market by 2025 positions it favorably as regulatory frameworks continue to evolve[3].
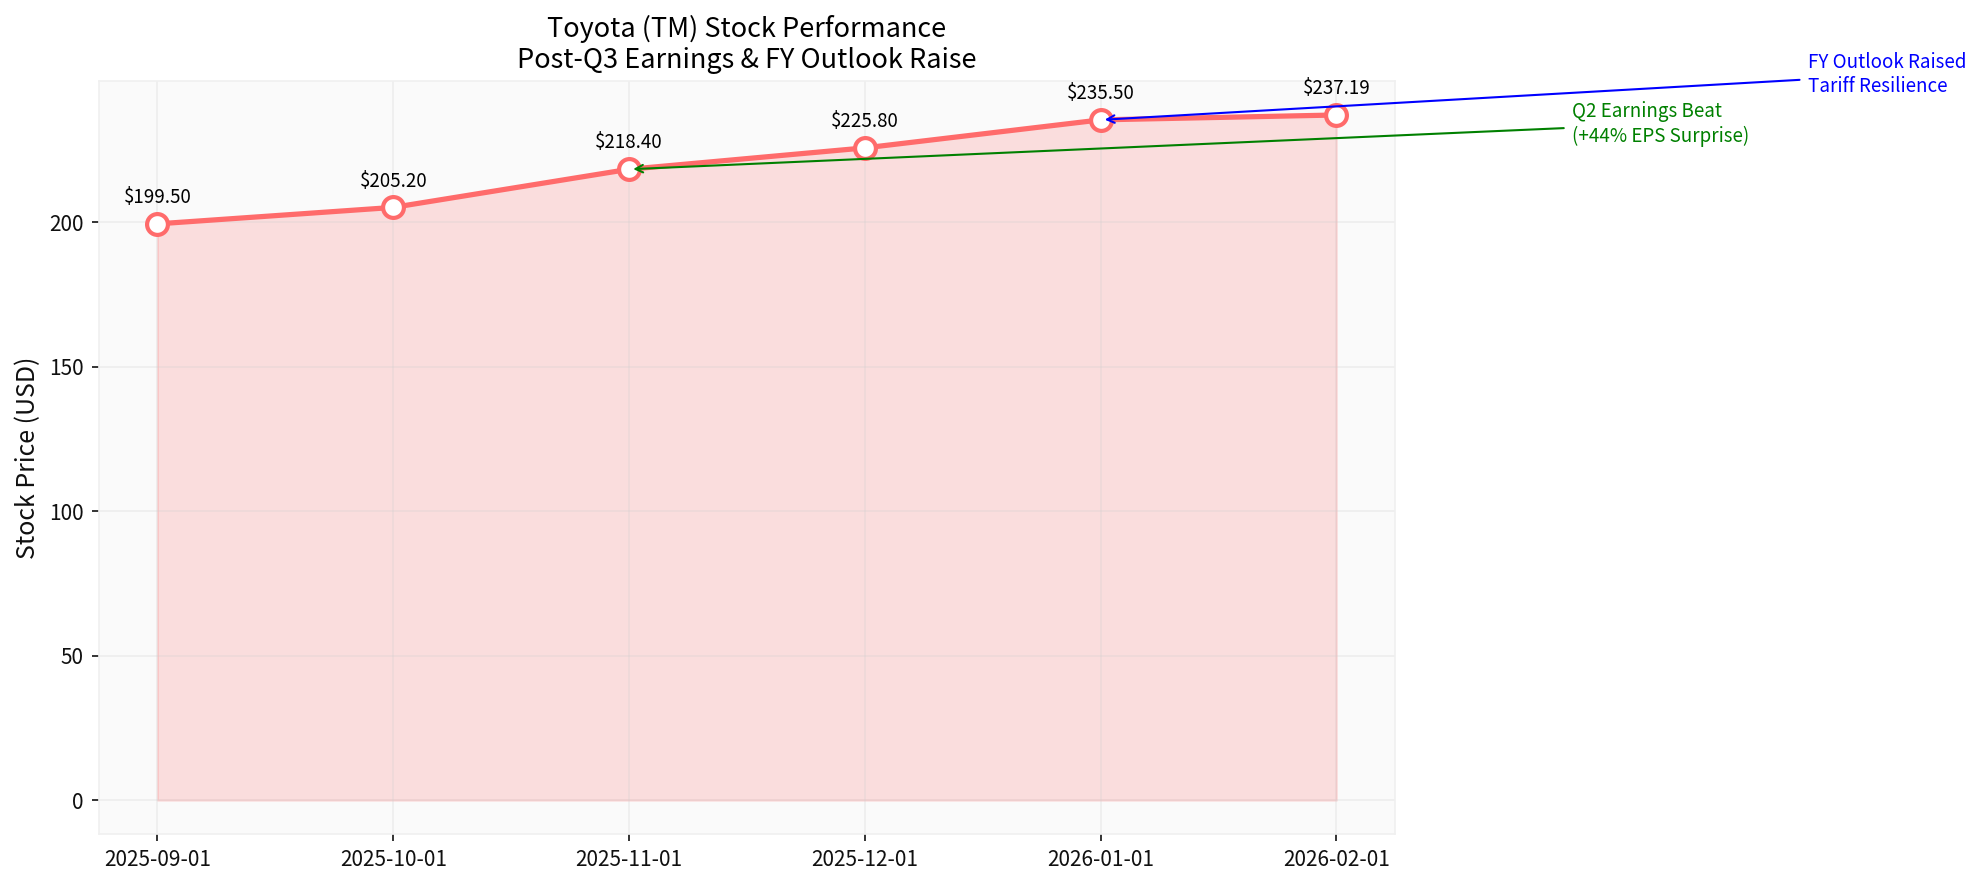
Toyota’s ADR (NYSE: TM) has delivered
| Period | Return |
|---|---|
| 1 Month | +8.38% |
| 3 Months | +19.10% |
| 6 Months | +30.68% |
| YTD | +8.87% |
| 1 Year | +21.42% |
| 3 Years | +64.96% |
The stock is trading at
| Indicator | Status | Interpretation |
|---|---|---|
Trend |
UPTREND (Breakout, pending confirmation) | Positive momentum |
MACD |
Bullish (no cross) | Strengthening |
KDJ |
Overbought territory (K:81.8, D:74.1) | Extended rally |
Key Support |
$229.04 | Immediate floor |
Key Resistance |
$242.96 | Near-term ceiling |
Next Target |
$247.63 | Extended upside |
Beta (vs S&P 500) |
0.18 | Low correlation to market |
The technical picture indicates an
Toyota’s resilient performance amid tariff pressures suggests the
- Premium for Production Localization: Companies with established localized manufacturing (Toyota, Honda) should command valuation premiums over import-dependent rivals
- Hybrid Technology Valuation: Traditional hybrids may be undervalued compared to pure EVs, with market potentially over-rotating toward BEV speculative narratives
- Operational Excellence Premium: Disciplined cost management and supply chain optimization capabilities should be rewarded in valuations
The tariff environment is
| Capability | Winners | Losers |
|---|---|---|
| U.S. manufacturing base | Toyota, Honda | Hyundai, Volkswagen |
| Hybrid technology depth | Toyota, Ford | New EV entrants |
| Cost absorption capacity | Scale players | Niche manufacturers |
Toyota’s demonstrated ability to maintain profitability despite $9.7 billion in tariff costs indicates substantial
- Hybrid Demand Acceleration: Strong U.S. and European demand for fuel-efficient vehicles should sustain revenue growth
- U.S. Manufacturing Expansion: Additional capacity coming online in 2026 will further reduce import dependency
- Margin Expansion: Cost reduction initiatives and scale benefits should drive operating margin improvement
- Leadership Stability: Management continuity (CEO Kenta Kon appointment) provides strategic execution continuity[1]
- Tariff Escalation: Further tariff increases could exceed Toyota’s absorption capacity
- EV Transition Disruption: Aggressive EV mandates could require costly technology pivot
- Currency Volatility: Yen appreciation could impact translated earnings
- Competition Intensification: Chinese manufacturers expanding into hybrid segments
With a
Toyota Motor Corporation’s Q3 FY2026 performance and raised full-year outlook represent a
- Structural Competitive Advantages: Decades of localized U.S. manufacturing have created sustainable moats
- Hybrid Strategy Validation: The hybrid-first approach has proven more resilient than pure-EV strategies amid current market conditions
- Operational Excellence: Disciplined cost management and manufacturing efficiency provide meaningful margin protection
- Valuation Opportunity: Current stock levels may underappreciate Toyota’s sustainable competitive positioning
For global automotive industry investors, Toyota’s performance suggests a
[1] Seeking Alpha - “Toyota Motor reports Q3 results; updates FY26 outlook” (February 6, 2026)
[2] CNBC - “Toyota hits record hybrids sales in 2025 as the auto giant adjusted to Trump’s tariffs” (January 29, 2026)
[3] OICA - “5 Major News Items Summarized” (January 27, 2026)
[0]金灵API数据 - Company Overview, Technical Analysis, Real-Time Quotes
数据基于历史,不代表未来趋势;仅供投资者参考,不构成投资建议
关于我们:Ginlix AI 是由真实数据驱动的 AI 投资助手,将先进的人工智能与专业金融数据库相结合,提供可验证的、基于事实的答案。请使用下方的聊天框提出任何金融问题。