Tech Stock Shakeout: Market Impact & Investment Strategy Analysis
解锁更多功能
登录后即可使用AI智能分析、深度投研报告等高级功能

关于我们:Ginlix AI 是由真实数据驱动的 AI 投资助手,将先进的人工智能与专业金融数据库相结合,提供可验证的、基于事实的答案。请使用下方的聊天框提出任何金融问题。
相关个股
Based on comprehensive market data and technical analysis, here’s a detailed assessment of the current tech sector sell-off and its implications for broader market sentiment and investment strategy.
The technology sector is undergoing a significant correction, with the S&P 500 tech index sliding
| Index | Current Level | Weekly Change | Status |
|---|---|---|---|
| S&P 500 (^GSPC) | 6,798.39 | -1.28% | Under pressure |
| NASDAQ Composite (^IXIC) | 22,540.59 | -2.43% | Leading decline |
| Dow Jones (^DJI) | 48,908.73 | -0.25% | Relative resilience |
| Russell 2000 (^RUT) | 2,577.65 | -2.12% | Small-cap weakness |
The NASDAQ’s sharp decline—falling 1.74% on February 3 and 1.35% on February 4—highlights the concentration of downside pressure in growth and tech-heavy segments [0]. However, the tech sector as a whole still shows marginal positive performance (+0.47%) on a year-to-date sector basis, indicating mixed signals [0].
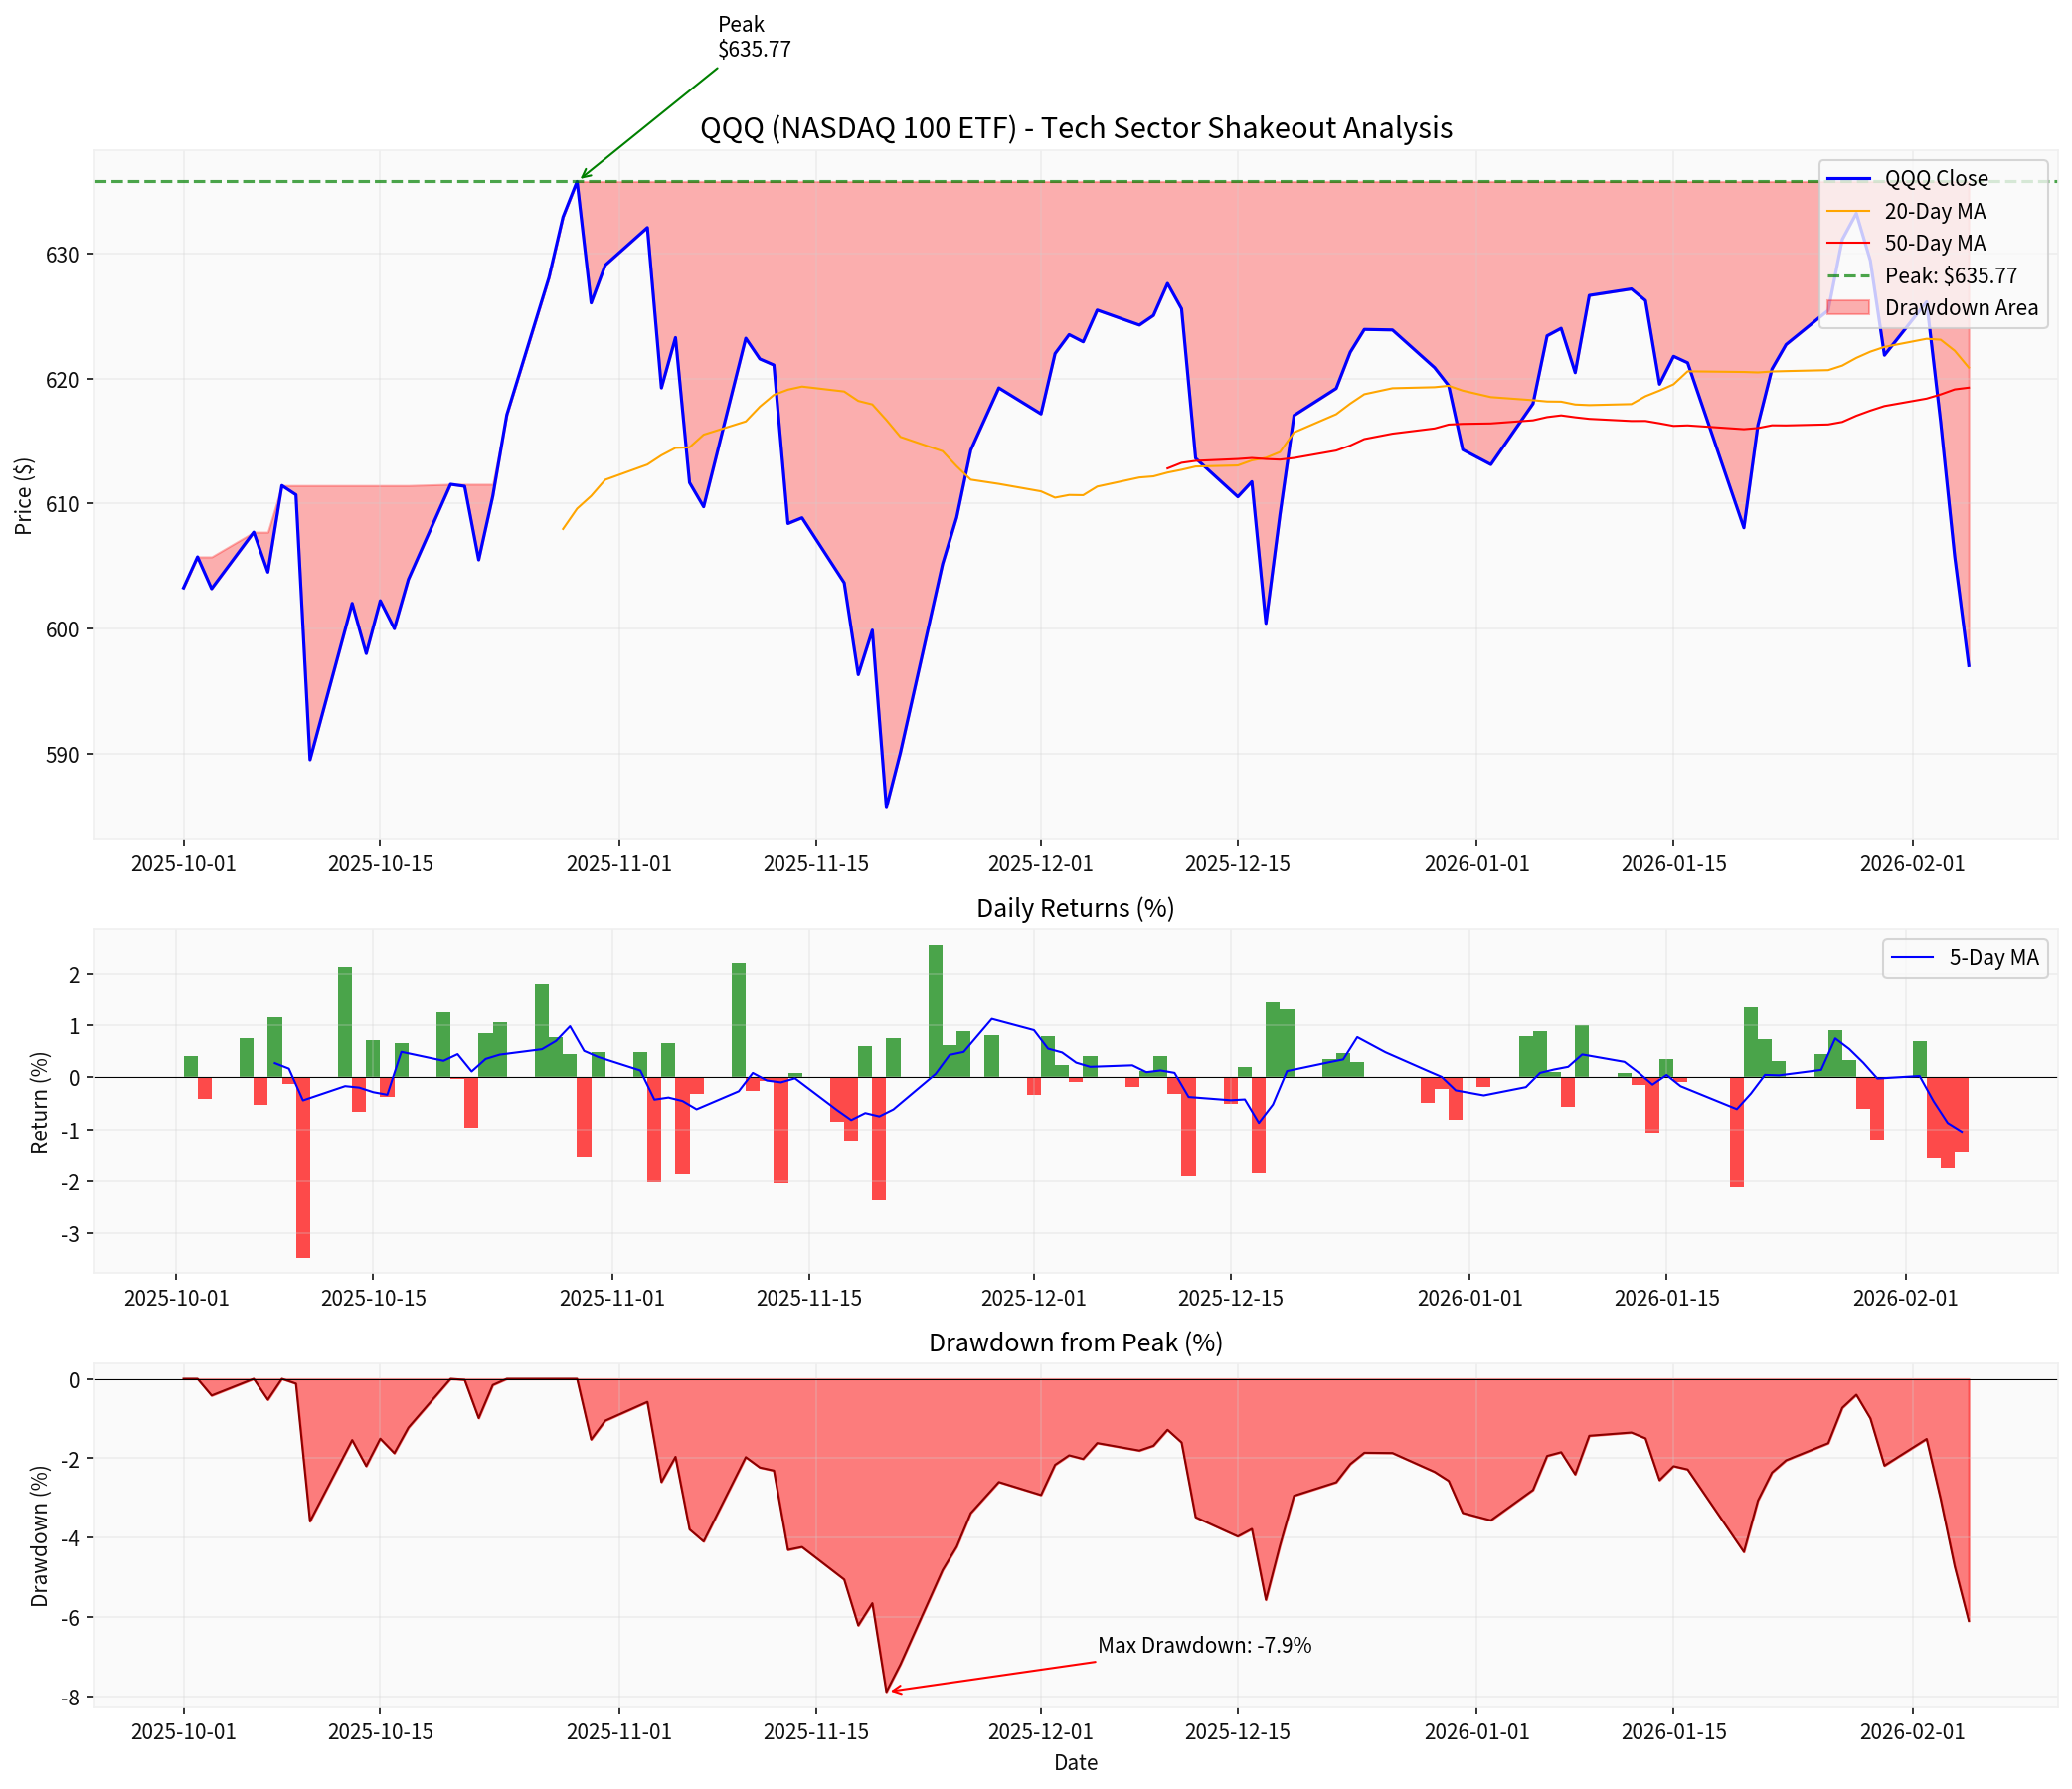
The QQQ ETF provides a comprehensive view of the tech sector’s technical health:
| Metric | Current Value | Interpretation |
|---|---|---|
| Current Price | $597.03 | Below key moving averages |
| 50-Day Moving Average | $619.27 | Price trading -3.59% below |
| Peak Price | $635.77 (Oct 29, 2025) | Current drawdown: -6.09% |
| Maximum Drawdown | -7.88% | Within normal correction range |
| 20-Day Annualized Volatility | 16.10% | Elevated but not extreme |
| 20-Day Avg Daily Return | -0.216% | Negative momentum |
The price action reveals that QQQ is currently trading below its 50-day moving average—a critical threshold that often signals short-term bearish sentiment. However, the maximum drawdown of -7.88% remains within historical norms for tech sector corrections, which typically range between 10-20% during normal market conditions.
A notable shift in market leadership is underway. While tech struggles, other sectors have demonstrated resilience [0]:
| Sector | Performance | Rotation Signal |
|---|---|---|
| Technology | +0.47% | Under pressure but holding |
| Real Estate | +0.25% | Defensive appeal |
| Utilities | +0.10% | Defensive appeal |
Consumer Cyclical |
-1.81% |
Weakness spreading |
Communication Services |
-1.23% |
Tech-adjacent weakness |
Basic Materials |
-2.49% |
Economic sensitivity |
This rotation pattern suggests investors are repositioning from high-growth tech positions toward more defensive and economically-sensitive sectors. Energy, consumer staples, and industrials have posted
Two critical data releases will shape market direction this week:
- Expected job creation: +70,000[1]
- This represents a significant slowdown from recent averages
- Implications: Weak employment data could reinforce Fed’s dovish stance but may also signal economic weakening
- Critical inflation reading for Fed policy
- Market expectations: Continued moderation in inflation
- Implications: Higher-than-expected CPI could rattle markets already sensitive to rate uncertainty
- Fed held rates at 3.50-3.75%in January 2026 meeting [1][2]
- Markets are pricing in two quarter-point rate cuts by December 2026
- Next expected cut: June 2026 FOMC meeting[1]
- Fed remains “data-dependent” with a cautious approach to further easing
The tech shakeout is likely to persist until the economic data provides clearer direction. Key considerations:
- Volatility Expectation: Elevated implied and realized volatility (16.10% annualized in QQQ) suggests continued price swings
- Support Levels: The 50-day MA ($619) and 200-day MA levels will be critical technical support zones
- Data Dependency: Market direction will be heavily influenced by payrolls and CPI outcomes
| Sector | Strategy | Rationale |
|---|---|---|
| Technology | Cautious |
Valuation pressure, AI sentiment shift |
| Software | Underweight |
-17% correction, earnings scrutiny |
| Communication Services | Neutral |
Tech-adjacent exposure |
| Consumer Staples | Favorable |
Defensive rotation beneficiary |
| Energy | Favorable |
Economic reopening beneficiary |
| Industrials | Favorable |
Infrastructure spending tailwinds |
- Geopolitical tensions: Rising risks could amplify market volatility [3]
- AI investment sustainability: Questions about ROI on massive AI capital expenditures
- Earnings guidance: Upcoming reports from AppLovin (APP), Datadog (DDOG), Cisco, and McDonald’s will test market resilience [1]
- Defensive positioning: Increase allocation to utilities and consumer staples
- Quality tilt: Favor large-cap tech with strong balance sheets over speculative AI plays
- Volatility management: Consider options strategies to hedge tech exposure
- Wait for clarity: Position sizing should remain conservative until CPI and payroll data are digested
The tech sector shakeout represents a healthy market correction following an extended period of AI-driven multiple expansion. The
- The tech correction is data-driven and sentiment-based, not fundamentally motivated
- Upcoming economic data(payrolls, CPI) will be the primary catalyst for near-term direction
- Sector rotationfrom tech to defensive/value sectors is likely to continue
- Fed policyremains accommodative, providing a floor for risk assets
- Long-term investorsshould view this pullback as a potential rebalancing opportunity in quality tech names
The market’s immediate direction hinges on whether the economic data validates the “soft landing” narrative or introduces uncertainty about growth. Investors should maintain flexibility in their positioning and be prepared for elevated volatility through the data deluge.
[0] 金灵API市场数据 (Market data from financial data API)
[1] Reuters - “Wall St Week Ahead: Tech stock shakeout clouds market ahead of economic data deluge” (https://www.reuters.com/business/wall-st-week-ahead-tech-stock-shakeout-clouds-market-ahead-economic-data-deluge-2026-02-06/)
[2] U.S. Bank - “Federal Reserve Calibrates Interest Rate Policy Amid Economic Uncertainty” (https://www.usbank.com/investing/financial-perspectives/market-news/federal-reserve-tapering-asset-purchases.html)
[3] Lanceroberts Substack - “Bull Bear Report: Week of January 30, 2026” (https://lanceroberts.substack.com/p/bull-bear-report-week-of-january-d69)
数据基于历史,不代表未来趋势;仅供投资者参考,不构成投资建议
关于我们:Ginlix AI 是由真实数据驱动的 AI 投资助手,将先进的人工智能与专业金融数据库相结合,提供可验证的、基于事实的答案。请使用下方的聊天框提出任何金融问题。