Expedia Group (EXPE): Outperform Rating Analysis & Competitive Positioning
解锁更多功能
登录后即可使用AI智能分析、深度投研报告等高级功能

关于我们:Ginlix AI 是由真实数据驱动的 AI 投资助手,将先进的人工智能与专业金融数据库相结合,提供可验证的、基于事实的答案。请使用下方的聊天框提出任何金融问题。
相关个股
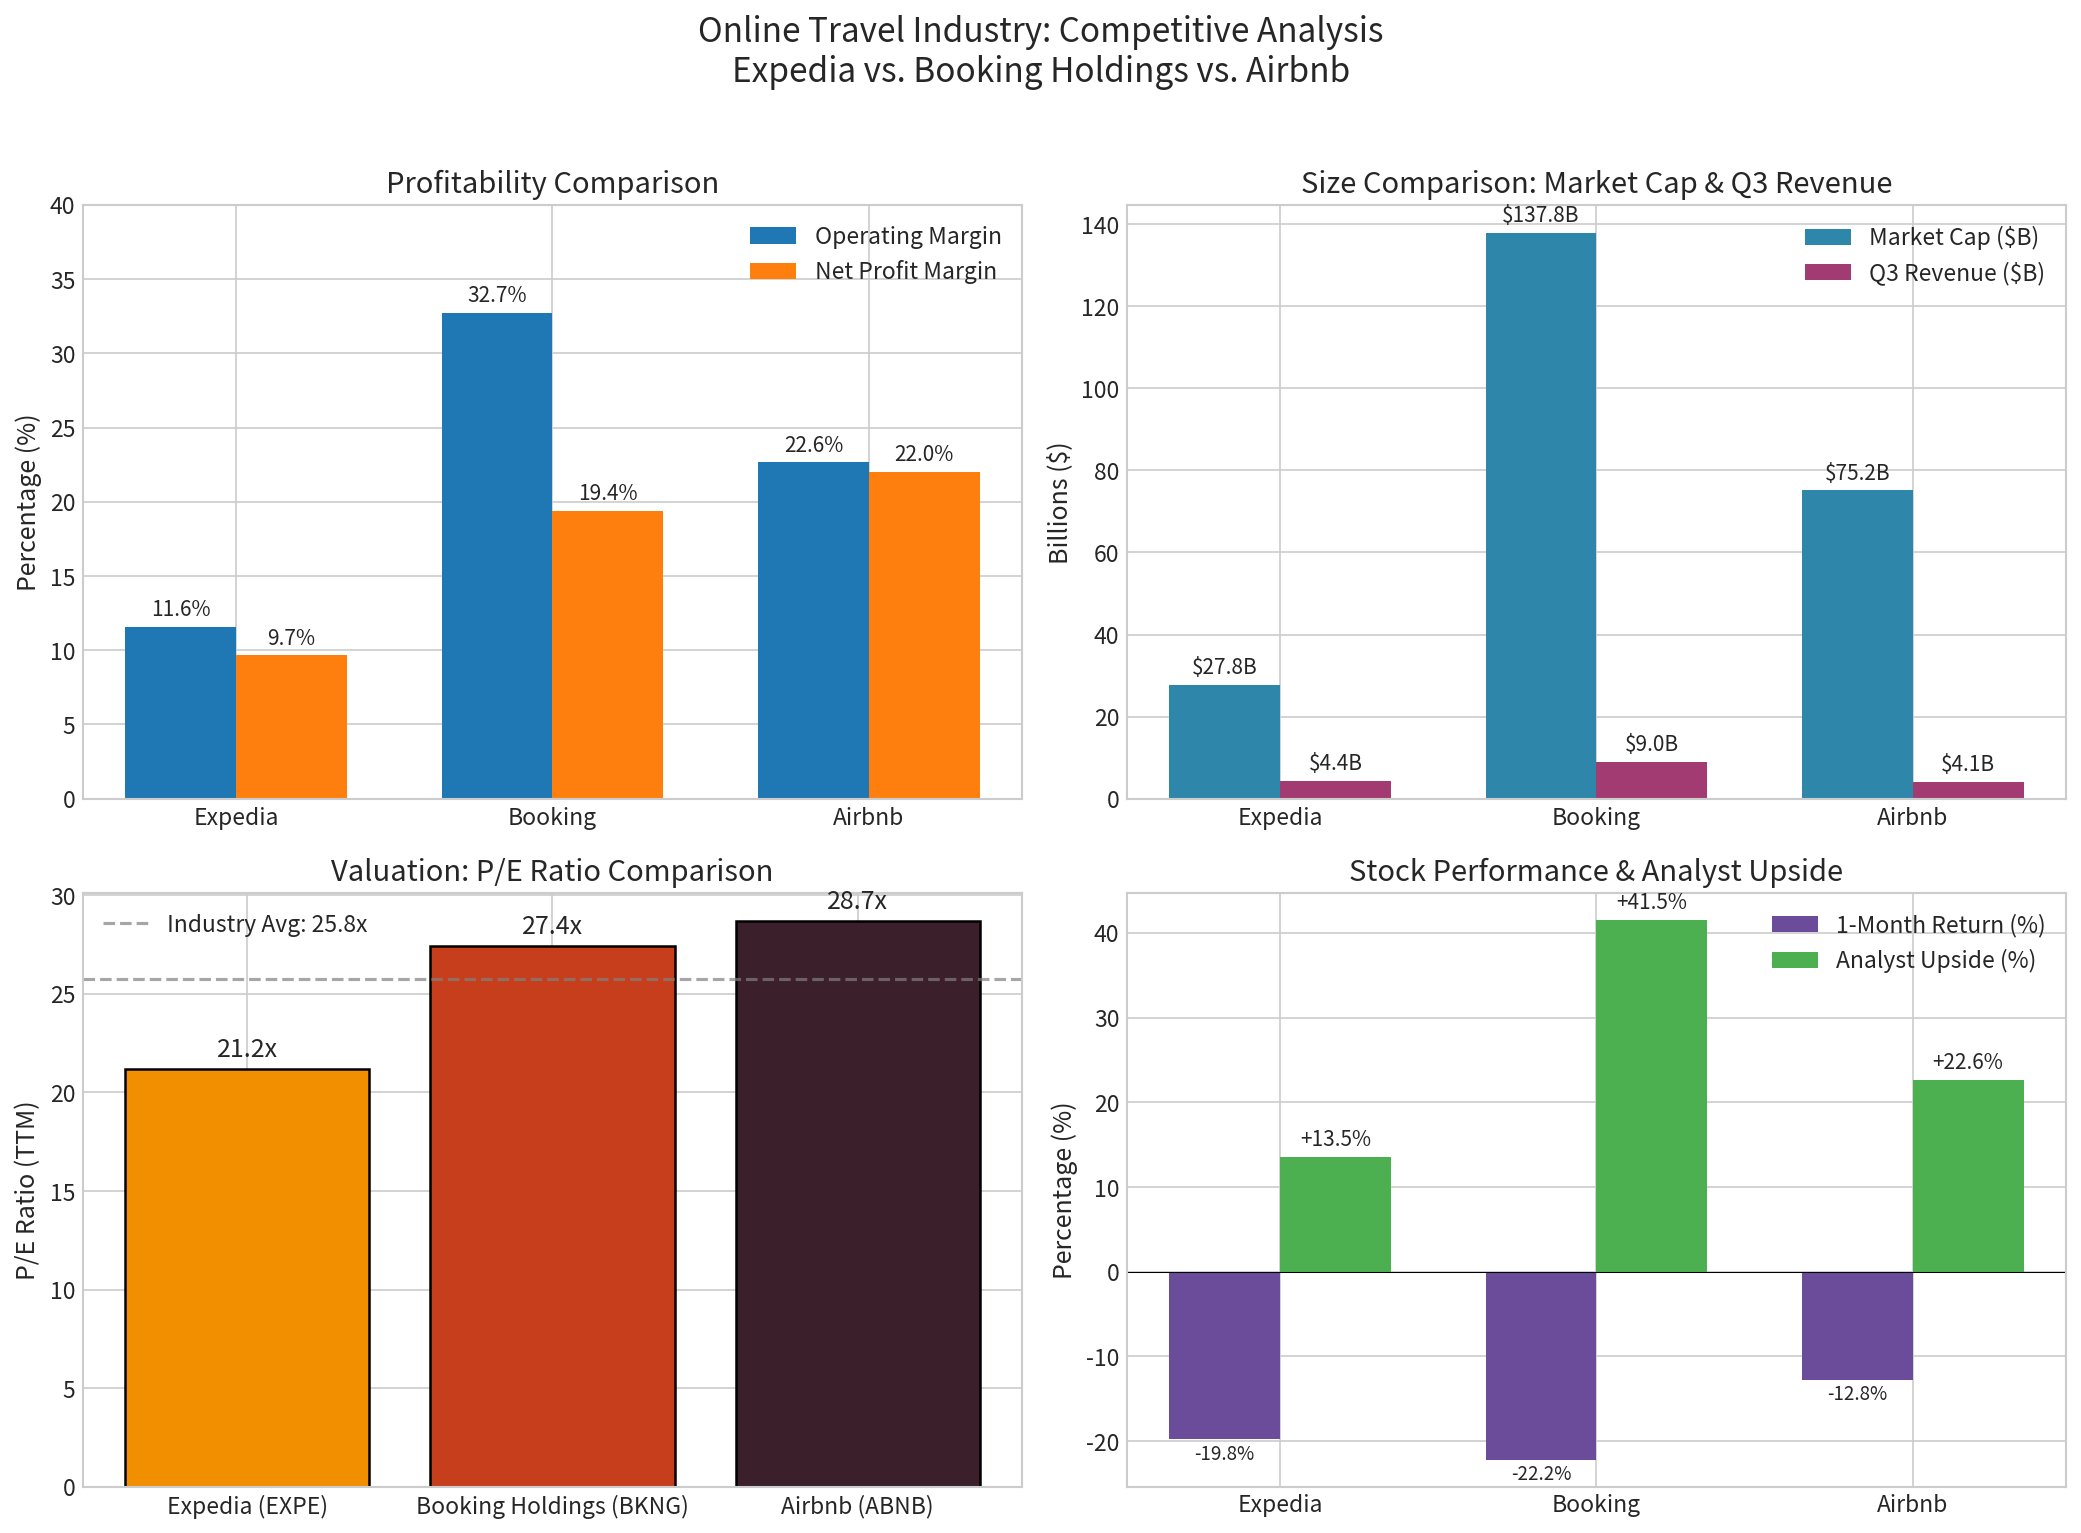
Evercore ISI has maintained its
Expedia trades at
| Company | P/E Ratio | Relative Valuation |
|---|---|---|
Expedia (EXPE) |
21.19x |
Most undervalued |
| Booking Holdings (BKNG) | 27.44x | 29% premium |
| Airbnb (ABNB) | 28.70x | 35% premium |
Evercore notes that Expedia’s valuation remains approximately
Expedia’s new CEO Ariane Gorin has driven meaningful operational improvements in 2025[3]:
- Q3 FY2025 Revenue: $4.41 billion (+3.0% vs. estimates)
- Q3 FY2025 EPS: $7.57 (+8.6% vs. $6.97 estimate)
- Stronger room night growthcompared to prior periods
- Improved marketing efficiencyreducing customer acquisition costs
The company’s 2025 turnaround has demonstrated clear recovery momentum, with the CEO projecting 2026 will be “very big” for U.S. tourism[3][4].
Despite industry-wide challenges, Expedia has delivered superior returns[0]:
| Metric | EXPE | BKNG | ABNB |
|---|---|---|---|
1-Year Return |
+17.14% |
-13.01% | -10.15% |
| 1-Month Return | -19.75% | -22.17% | -12.75% |
| YTD Return | -15.96% | -19.70% | -8.65% |
Expedia’s
- Evercore ISI Target: $350.00 (47% upside from current levels)
- Consensus Target: $270.00 (13.5% upside)
- Target Range: $200.00 - $330.00[0][2]
With 44.6% of analysts rating EXPE a “Buy” and a consensus price target suggesting meaningful upside, the stock offers compelling risk-reward.
The online travel agency (OTA) industry shows clear market leadership dynamics[5][6]:
| Company | Market Share | Position |
|---|---|---|
| Booking Holdings | ~40% | Market Leader |
| Airbnb | ~18-19% | Growing Sharply |
Expedia Group |
~15% | #2 Position Under Pressure |
| Trip.com Group | Regional | Asian Markets |
| Metric | EXPE | BKNG | Implication |
|---|---|---|---|
Market Cap |
$27.82B | $137.78B | BKNG is 5x larger |
Operating Margin |
11.60% | 32.74% | BKNG 2.8x more efficient |
Net Margin |
9.66% | 19.37% | BKNG 2x profitability |
Current Ratio |
0.74 | 1.33 | BKNG better liquidity |
P/E Ratio |
21.19x | 27.44x | EXPE 23% discount |
- Trades at significant discount to market leader
- Stronger presence in North American market
- More diverse brand portfolio (Expedia, Hotels.com, Vrbo)
- Superior profitability and margins
- Better liquidity position
- Dominance in international markets
- Higher ROE (when positive)
| Metric | EXPE | ABNB | Implication |
|---|---|---|---|
Q3 Revenue |
$4.41B | $4.09B | Similar scale |
Operating Margin |
11.60% | 22.65% | ABNB 2x more efficient |
Net Margin |
9.66% | 22.03% | ABNB significantly higher |
ROE |
1.16% | 32.14% | ABNB vastly superior |
Beta |
1.38 | 1.10 | ABNB less volatile |
P/E Ratio |
21.19x | 28.70x | EXPE 26% discount |
- Lower valuation multiple
- Broader service offerings (lodging + air + packages)
- Established brand portfolio
- Superior profitability metrics
- Better return on equity
- Lower volatility profile
- Stronger EMEA presence (48% of revenue)[0]
┌────────────────────────┬──────────┬──────────┬──────────┐
│     Factor             │  EXPE    │   BKNG   │   ABNB   │
├────────────────────────┼──────────┼──────────┼──────────┤
│ Valuation Attractiveness│   ★★★    │    ★★    │    ★★    │
│ Margin Profile         │    ★★    │   ★★★    │   ★★★    │
│ Market Share           │    ★★    │   ★★★    │   ★★★    │
│ Liquidity              │    ★     │   ★★★    │   ★★★    │
│ Growth Momentum        │   ★★★    │    ★★    │    ★★    │
│ Balance Sheet Strength │    ★★    │   ★★★    │   ★★★    │
│ Analyst Sentiment      │   ★★★    │   ★★★    │    ★★    │
├────────────────────────┼──────────┼──────────┼──────────┤
│ OVERALL RATING         │   19/28  │  23/28   │  22/28   │
└────────────────────────┴──────────┴──────────┴──────────┘
- Trend: Sideways/No clear trend
- Support Level: $232.11
- Resistance Level: $267.47
- Beta: 1.38 (vs. SPY)
- Trading Range: $232-$267
The stock is currently trading near the bottom of its established range, potentially offering a favorable entry point.
- Market Share Erosion: Expedia continues to lose ground to Booking Holdings and Airbnb[6]
- Margin Pressure: Operating margin (11.6%) significantly lags peers (22-33%)
- Liquidity Concerns: Current ratio of 0.74 indicates potential short-term financial stress
- Marketing Intensity: Heavy advertising spend required to compete with larger rivals
- Google Canvas/SEO Risk: Competition from Google’s travel search features
Evercore ISI’s
- Valuation Arbitrage: Trading at 21.2x P/E (vs. 27-29x for peers) with ~20% upside to consensus
- Turnaround Validation: New leadership delivering earnings beats and improved operational metrics
- Relative Strength: Outperforming peers on a one-year basis despite competitive pressures
- Recovery Catalyst: 2026 expected to be a strong year for travel demand
While Expedia faces margin and market share challenges versus Booking Holdings and Airbnb, its
[0] 金灵API - Expedia Group Company Overview
[1] Intellectia.ai - Evercore ISI Names Amazon and Expedia as Top Long Picks for 2026
[2] Investing.com - Expedia Stock Rating Reiterated at Outperform by Evercore
[3] Hospitality Today - Expedia’s 2025 Turnaround Gains Momentum
[4] Fortune - Expedia Group CEO on 2026 Outlook
[5] CSIMarket - EXPE Market Share vs Competitors Q3 2025
[6] Skift - 10 Biggest Online Travel Agencies
[7] 金灵API - Expedia Technical Analysis
数据基于历史,不代表未来趋势;仅供投资者参考,不构成投资建议
关于我们:Ginlix AI 是由真实数据驱动的 AI 投资助手,将先进的人工智能与专业金融数据库相结合,提供可验证的、基于事实的答案。请使用下方的聊天框提出任何金融问题。