Market Analysis: Record-High Shiller CAPE Ratio and Extreme Fear Signal Potential Turning Point
解锁更多功能
登录后即可使用AI智能分析、深度投研报告等高级功能
关于我们:Ginlix AI 是由真实数据驱动的 AI 投资助手,将先进的人工智能与专业金融数据库相结合,提供可验证的、基于事实的答案。请使用下方的聊天框提出任何金融问题。
This analysis is based on a Reddit post [1] published on November 7, 2025, which warned about an alarming market combination of record-high Shiller CAPE valuations alongside extreme market fear, suggesting a potential market turning point.
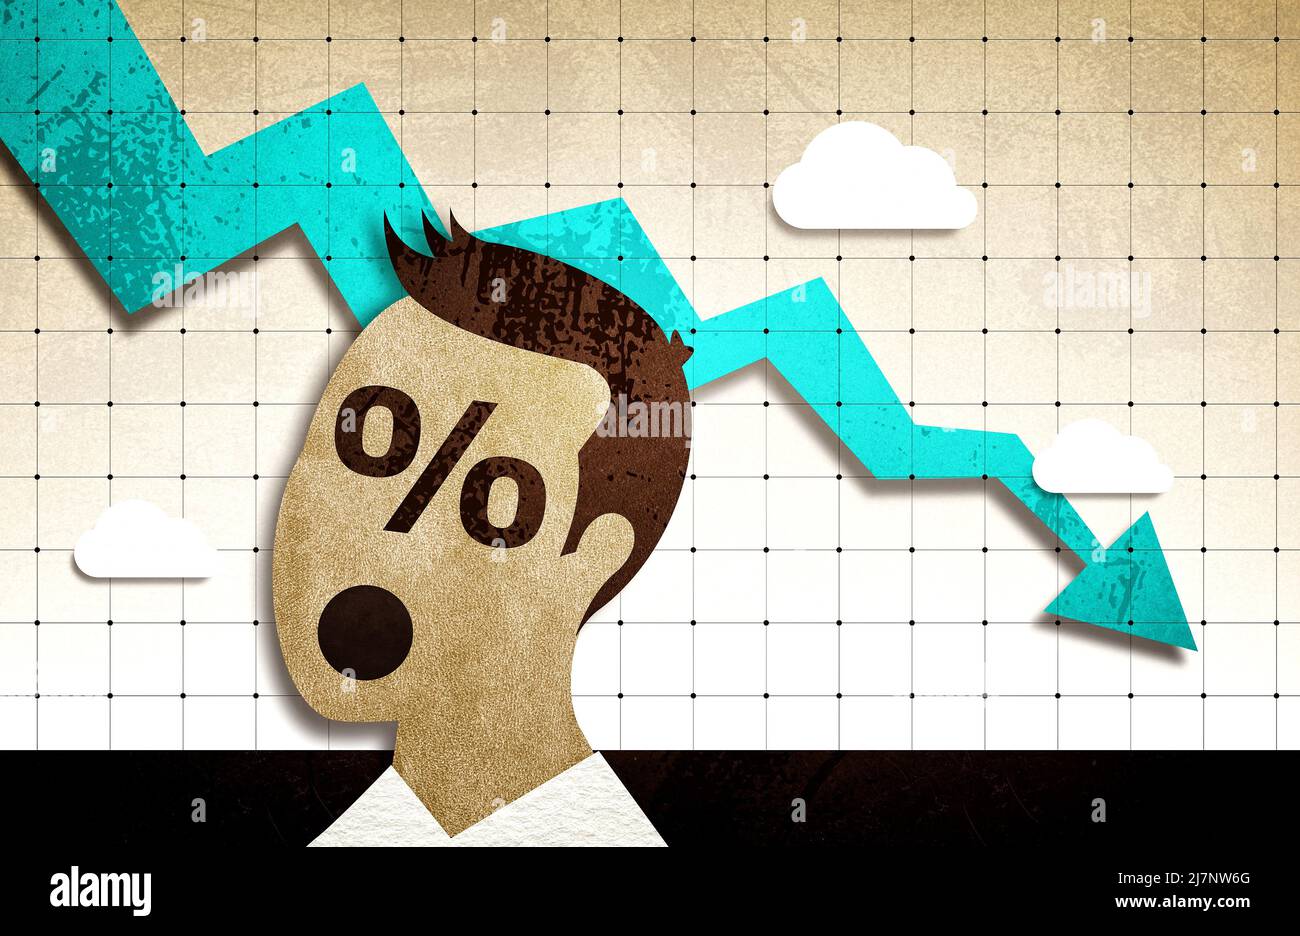
The current market environment presents a concerning convergence of valuation extremes and deteriorating sentiment. The S&P 500 Shiller CAPE Ratio stands at
Simultaneously, market sentiment has deteriorated to extreme levels. CNN’s Fear & Greed Index reads
Historical analysis reveals that this combination of record-high valuations and extreme fear has preceded major market crashes including 1929, the early 1970s, and 2000 [1]. The current CAPE level of 39.51 is only slightly below the dot-com bubble peak, and historical implied returns at current CAPE levels suggest approximately 1.5% annual market returns going forward [2].
- Utilities: +4.68% (strongest performer - typical safe haven)
- Financial Services: +2.26%
- Energy: +1.81%
- Technology: +0.05% (significantly underperforming)
- Consumer Defensive: -0.61% (surprisingly weak)
The technology sector’s minimal gains despite overall market stability supports concerns about AI stock valuations mentioned in recent market analysis [5].
- S&P 500: +1.01% (range: $6,550.78 - $6,920.34)
- NASDAQ: +1.77% (range: $22,193.07 - $24,019.99)
- Dow Jones: +1.47% (range: $45,452.03 - $48,040.64)
- Russell 2000: -0.40% (underperforming larger caps)
The divergence between market indices (still positive) and sentiment indicators (extreme fear) creates uncertainty about short-term direction.
- Valuation-Contraction Risk:At current CAPE levels, historical patterns suggest potential for significant market corrections over extended periods [2][3].
- Liquidity Stress:The combination of high valuations and fear sentiment could trigger rapid capital outflows, particularly from overvalued tech sectors [0].
- Earnings Disappointment:Any weakness in Q4 earnings could trigger disproportionate market reactions given elevated expectations [5].
- Market Concentration Risk:Heavy concentration in mega-cap tech stocks could exacerbate volatility during corrections.
- Q4 2025 Earnings Season:Particularly guidance from AI-related companies
- Federal Reserve Policy:Any changes to interest rate outlooks
- VIX Trends:Sustained elevation above 25 would signal increased crash probability
- Market Breadth:Continued underperformance of small caps could indicate systemic issues
- Credit Markets:Junk bond market stress would confirm broader risk aversion [6]
The analysis reveals several risk factors that warrant attention. The divergence between market performance and sentiment creates uncertainty, while historical analysis suggests the risk-reward ratio at current valuations is unfavorable. Defensive positioning and quality focus may be prudent until valuation metrics normalize.
- Shiller CAPE Ratio:39.51 (second-highest in history, up 1.69% from last month) [2]
- Fear & Greed Index:21 (extreme fear territory) [4]
- Historical Context:Current combination preceded major crashes in 1929, 1970s, and 2000 [1]
- Market Performance:Mixed indices with defensive sector rotation [0]
- Tech Sector:Underperforming (+0.05%) despite overall market stability [0]
- Forward Returns:Historical analysis suggests ~1.5% annual returns at current CAPE levels [2]
- Risk Level:Elevated - potential for 20-40% corrections based on historical patterns [2][3]
This information synthesis highlights the current market’s elevated risk profile, driven by extreme valuations combined with deteriorating sentiment. Historical precedent suggests caution is warranted, though timing of any potential correction remains uncertain.
数据基于历史,不代表未来趋势;仅供投资者参考,不构成投资建议
关于我们:Ginlix AI 是由真实数据驱动的 AI 投资助手,将先进的人工智能与专业金融数据库相结合,提供可验证的、基于事实的答案。请使用下方的聊天框提出任何金融问题。