Conflict Escalation and Market Impact Scenarios
解锁更多功能
登录后即可使用AI智能分析、深度投研报告等高级功能
关于我们:Ginlix AI 是由真实数据驱动的 AI 投资助手,将先进的人工智能与专业金融数据库相结合,提供可验证的、基于事实的答案。请使用下方的聊天框提出任何金融问题。
相关个股
Based on current market data and recent developments, prolonged Russia-Ukraine conflict escalation could significantly influence energy markets and defense sector valuations through multiple channels. This analysis synthesizes recent geopolitical events, market pricing, and sector performance data[0][1][2][3][4][5].
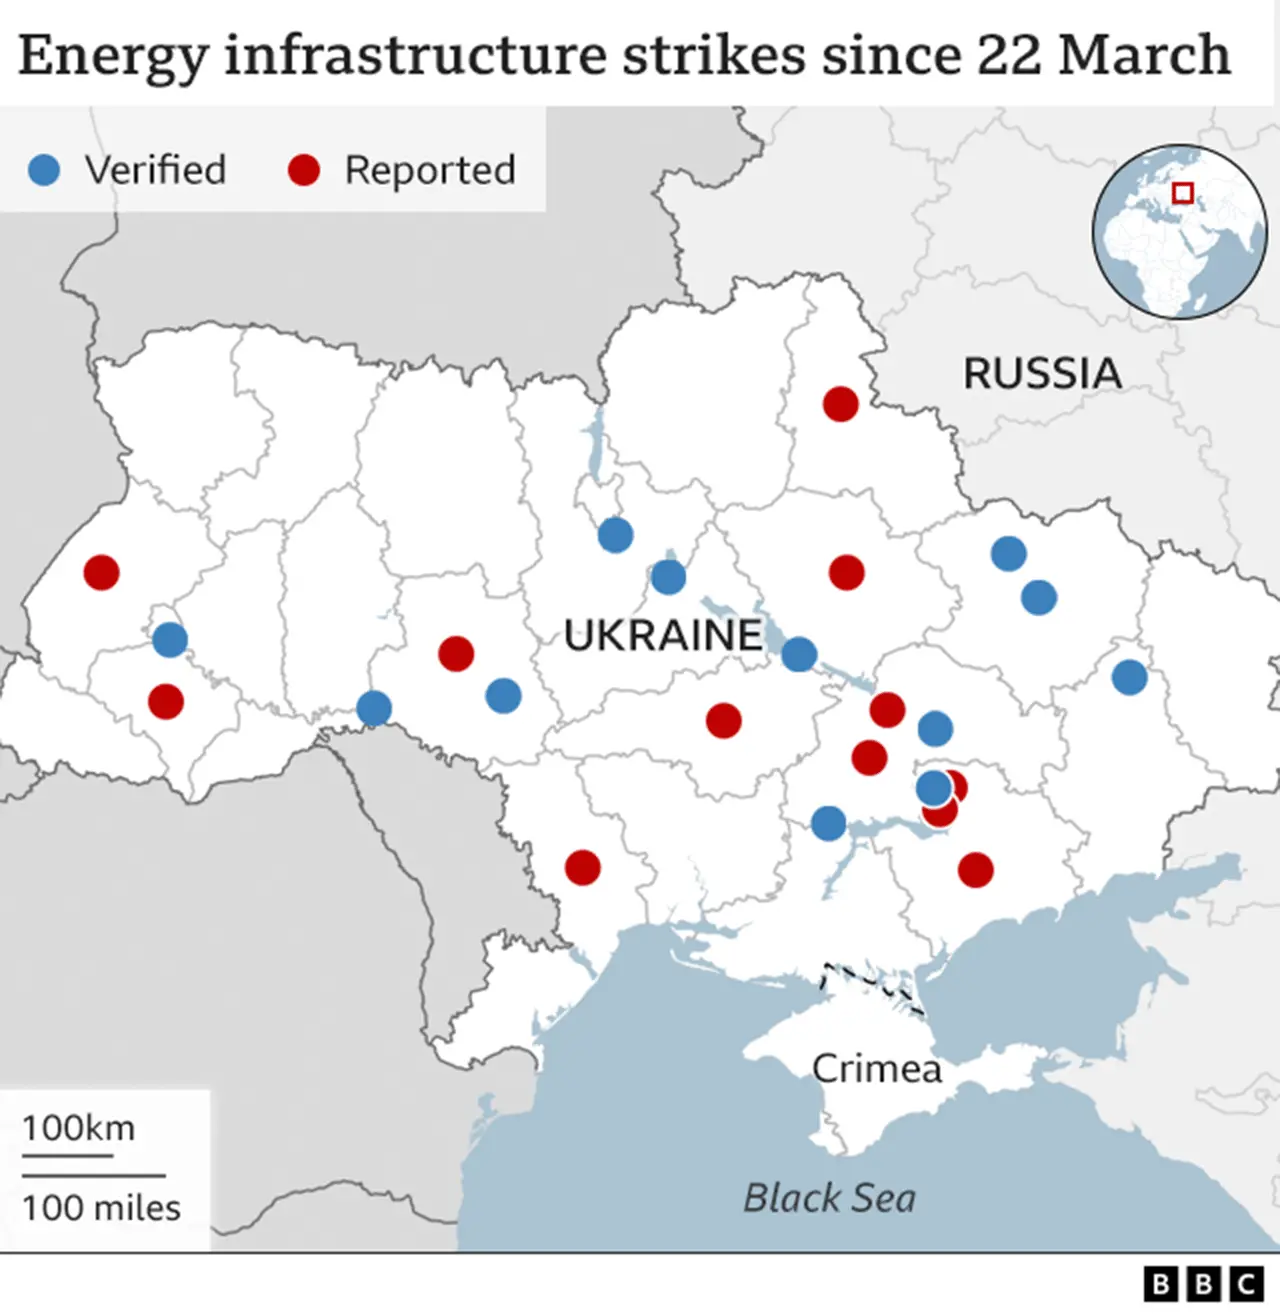
Recent reports indicate increased intensity in drone warfare and missile strikes. Russian forces have launched large-scale drone attacks targeting Ukrainian transport and critical infrastructure, with reported strikes on energy and rail infrastructure and drone attacks on Kyiv causing casualties ahead of diplomatic meetings[1][2][3]. The Russian Ministry of Defense reported downing 111 Ukrainian drones in a three-hour period (per user-provided context), underscoring the expanding scale of drone warfare.
- Energy sector is down 0.41405% today[0], reflecting short-term market sentiment amid holiday-affected trading.
- Key energy ETF pricing:
- XLE (Energy Select Sector SPDR): $44.20, P/E 17.38[0]
- XOP (Oil & Gas Exploration & Production): $124.96, P/E 12.74[0]
- XLE: Period change +4.69%; 52-week range $37.24–$47.41[0]
- XOP: Period change -9.36%; 52-week range $99.01–$146.56[0]
- Supply risk:Escalation could increase supply disruptions risk, supporting price volatility. Historical patterns include sharp moves when infrastructure attacks occurred.
- Sanctions ripple:Continued or expanded sanctions may tighten supply for sanctioned entities, potentially shifting market dynamics. A recent report highlighted business impacts on certain fuel retailers due to sanctions[6].
- Demand changes:Sustained conflict can affect European demand and substitution toward alternative sources.
- Lockheed Martin (LMT): $483.03, P/E 26.88[0]; 2024–2025 period change +6.32%[0]
- RTX: $185.17, P/E 38.02[0]
- Northrop Grumman (NOC): $577.37, P/E 20.79[0]
- General Dynamics (GD): $342.20, P/E 22.16[0]
- LMT: Period high $618.95; period low $410.11; 52-week range $410.11–$516.00[0]
- Sector trend shows elevated defense spending patterns, with historical gains around earlier escalations.
- Replenishment demand:Higher ammunition and equipment consumption creates sustained orders.
- Allied support:NATO and allied commitments increase procurement.
- Technology emphasis:Drones, missile defense, and electronic warfare priorities could favor companies with relevant capabilities.
- Backlog visibility:Major contractors’ multi-year contracts provide earnings visibility.
- Energy:Elevated volatility with periodic spikes on news of infrastructure attacks or supply constraints. XLE/XOP could see price swings near recent volatility levels (historical daily std. dev: XLE 1.35%, XOP 1.76%[0]).
- Defense:Modest upside aligned with budgetary execution and backlog conversion. Multiples near current levels absent major program shifts.
- Energy:Sustained price elevation if infrastructure is repeatedly targeted or sanctions tighten further. Historical patterns suggest sharp upside moves, but duration can be limited by demand adjustments and alternative supplies.
- Defense:15–25% earnings growth potential via higher orders and accelerated procurement. Valuation multiples could compress modestly on strong fundamentals, yielding total returns primarily driven by earnings. High P/E names (e.g., RTX at 38.02[0]) offer room for multiple rerating if delivery risk declines.
- Energy:Mean reversion toward pre-conflict pricing dynamics as risk premia fade.
- Defense:Valuation pressure from lower-than-expected procurement growth; backlogs may shrink relative to elevated expectations.
- Infrastructure attack frequency and scale (e.g., energy and rail targeting)[1][2][3]
- Sanctions policy changes (e.g., measures affecting Russian energy entities)[6]
- NATO and allied defense budget allocations and procurement timelines
- OPEC+ production decisions and inventory levels
- U.S. and European defense appropriations and program authorizations
- Energy:Favor high-quality, diversified names; commodity exposure and geopolitical risk can produce outsized moves but require active risk management.
- Defense:Emphasize backlog depth and program diversification; monitor execution on delivery and cost overruns. Historical data show LMT’s significant price range during past escalations (period high $618.95 vs. low $410.11)[0].
- [0] 金灵API数据
- [1] Institute for the Study of War - Russian Offensive Campaign Assessment (Dec 22, 2025), https://understandingwar.org/research/russia-ukraine/russian-offensive-campaign-assessment-december-22-2025/
- [2] New York Post - “Russian drones, missiles pound Ukraine before Zelensky’s meeting with Trump” (Dec 27, 2025), https://nypost.com/2025/12/27/world-news/russian-drones-missiles-pound-ukraine-before-zelenskys-meeting-with-trump/
- [3] Times of Israel - “Russia attacks Kyiv with missiles and drones, wounding 11 ahead of Ukraine-US meeting” (Dec 27, 2025), https://www.timesofisrael.com/liveblog_entry/russia-attacks-kyiv-with-missiles-and-drones-wounding-11-ahead-of-ukraine-us-meeting/
- [4] Bloomberg - “US Lukoil Gas Station Owners Left in Limbo Over Russia Sanctions” (Dec 27, 2025), https://www.bloomberg.com/news/articles/2025-12-27/us-lukoil-gas-station-owners-left-in-limbo-over-russia-sanctions
- [5] TechCrunch - “The 7 top space and defense tech startups from Disrupt Startup Battlefield” (Dec 27, 2025), https://techcrunch.com/2025/12/27/the-7-top-space-and-defense-tech-startups-from-disrupt-startup-battlefield/
- [6] U.S. Department of Defense - Acquisition Transformation Strategy (Nov 10, 2025), https://media.defense.gov/2025/Nov/10/2003819441/-1/-1/1/ACQUISITION-TRANSFORMATION-STRATEGY.PDF
数据基于历史,不代表未来趋势;仅供投资者参考,不构成投资建议
关于我们:Ginlix AI 是由真实数据驱动的 AI 投资助手,将先进的人工智能与专业金融数据库相结合,提供可验证的、基于事实的答案。请使用下方的聊天框提出任何金融问题。