AI Spending Risks Impact on Optical Networking Stocks: Ciena Case Study
解锁更多功能
登录后即可使用AI智能分析、深度投研报告等高级功能
关于我们:Ginlix AI 是由真实数据驱动的 AI 投资助手,将先进的人工智能与专业金融数据库相结合,提供可验证的、基于事实的答案。请使用下方的聊天框提出任何金融问题。
相关个股
Based on comprehensive data analysis, I will now provide a detailed examination of how rising AI spending risks may impact valuations of optical networking and infrastructure stocks, with a focus on Ciena Corporation (CIEN).
Bank of America Securities recently downgraded Ciena Corporation from
- Extreme Valuation Levels: Ciena trades at a P/E ratio of approximately286.6x, representing substantial earnings multiples that leave little margin for error [2]
- Peak Margin Risk: The company may have reached cyclical margin peaks, with limited upside potential
- Order/Backlog Deterioration Risk: Potential for slower order trends and declining backlog levels
- Spending Rationalization: Risk that network providers may delay or reduce capital expenditure as they await demand ramp-up [2]
Despite these concerns, BofA acknowledged that deployment plans among key cloud and neocloud leaders remain intact, suggesting continued underlying demand for optical networking equipment [2].
Ciena has delivered
| Performance Metric | Value |
|---|---|
| 1-Year Return | +173.30% |
| 6-Month Return | +185.20% |
| 3-Month Return | +40.00% |
| Current Price | $241.79 |
| 52-Week Range | $49.21 - $261.13 |
| Market Cap | $34.11 billion |
| Metric | Value | Assessment |
|---|---|---|
| P/E Ratio (TTM) | 278-286x |
Extremely elevated |
| P/B Ratio | 12.57x |
High relative to historical norms |
| P/S Ratio | 7.17x |
Premium valuation |
| EV/OCF | 43.02x |
Steep enterprise value multiple |
The consensus price target of
The optical networking sector’s fortunes are inextricably linked to hyperscaler capital expenditure patterns. Current data reveals a nuanced picture:
| Year | Projected CapEx | Year-over-Year Growth |
|---|---|---|
| 2024 | ~$200 billion | Base year |
| 2025 | $300-350 billion [3][4] |
~50-75% |
| 2026 | $400+ billion [4] |
Growth rate slowing to ~25% |
According to Goldman Sachs Research, while consensus estimates have consistently underestimated AI-related capital expenditure, the
- Amazon (AWS): On pace to exceed$100 billionin CapEx for 2025 [3]
- Microsoft: Raised 2025 CapEx outlook substantially
- Meta: Guides$66-72 billionfor 2025, potentially doubling year-over-year [3]
- Google: Lifted 2025 forecast by $10 billion to approximately$85 billion[3]
The optical networking and communications market is projected to grow from
Technical indicators reveal a stock in consolidation mode with mixed signals:
- Overall Assessment: Sideways/no clear trend
- Trading Range: $236.03 (support) to $250.93 (resistance)
- Beta: 1.14 relative to S&P 500, indicating above-average volatility
| Indicator | Value | Signal |
|---|---|---|
| MACD | No cross | Bearish |
| KDJ | K:58.4, D:56.7, J:61.6 | Bullish |
| RSI (14) | Normal range | Neutral |
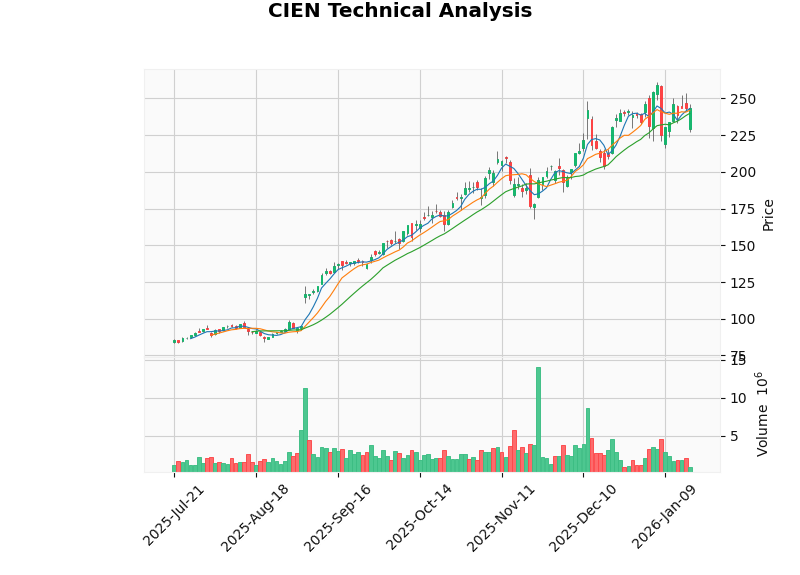
The chart above illustrates Ciena’s recent price action, showing the stock trading near the upper end of its recent range after a substantial rally. The bearish MACD signal combined with neutral RSI suggests caution among technical traders [6].
Ciena’s fundamental financial profile presents a
- Low Debt Risk Classification: The company maintains conservative leverage levels [6]
- Strong Liquidity: Current ratio of 2.73 and quick ratio of 2.09 indicate robust short-term financial health [1]
- Positive Free Cash Flow: Latest FCF of approximately $665 million supports ongoing operations and shareholder returns [6]
- Neutral Accounting Practices: Company maintains balanced accounting without persistent extremes [6]
- EPS: $0.91 actual vs. $0.78 estimate (+16.67% surprise) [1]
- Revenue: $1.35 billion actual vs. $1.29 billion estimate (+4.72% surprise) [1]
- Full-Year Revenue Growth: 18.79% YoY [2]
| Segment | Revenue | % of Total |
|---|---|---|
| Networking Platforms | $941.35M | 77.2% |
| Global Services | $160.26M | 13.1% |
| Software & Services | $117.76M | 9.7% |
The company’s
- Valuation Risk: The extreme P/E multiple of ~286x prices in perfection and leaves no margin for disappointment
- Cyclical Exposure: Optical networking is highly cyclical and dependent on telecom/hyperscaler capital expenditure cycles
- Customer Concentration: Heavy reliance on major cloud providers creates execution risk if any key customer reduces orders
- Margin Peak: Operating margin of 6.52% and net profit margin of 2.59% may have peaked [1]
- Growth Deceleration: Expected slowdown in hyperscaler CapEx growth from 75% to 25% represents a meaningful headwind [4]
- Continued AI infrastructure buildout exceeding expectations
- New product cycle adoption (WaveLogic platforms, Blue Planet software)
- Share repurchase program (completed $361.46 million buyback by December 2025) [7]
- Potential for revenue outperformance driven by data center interconnect demand
- Hyperscaler CapEx slowdown faster than anticipated
- Order deferrals or cancellations from major customers
- Competitive pressure from Cisco (CSCO), Infinera (INFN), and other optical networking vendors
- General rotation away from AI infrastructure stocks [4]
Ciena has significantly outperformed the broader technology sector and market indices:
| Index/Stock | 3-Month Return |
|---|---|
| Ciena (CIEN) | +40.00% |
| S&P 500 | -0.08% |
| NASDAQ Composite | -1.16% |
| Russell 2000 | +4.88% |
| Communication Equipment Sector | Mixed |
The technology sector has shown modest gains (+0.25%), while Ciena’s outperformance reflects its positioning as a key beneficiary of AI infrastructure buildout [8].
The intersection of extreme valuation and emerging AI spending concerns creates a
- Bull Case: Continued AI infrastructure buildout, market share gains, operating leverage improvement
- Bear Case: Valuation compression, customer concentration risk, CapEx deceleration, margin peak
Given the current risk-reward profile following the Bank of America downgrade, a
[1] Company Overview and Financial Data - Retrieved from Financial Database (2026-01-20)
[2] Investing.com - “Ciena stock rating downgraded to Neutral from Buy by BofA Securities” (https://www.investing.com/news/analyst-ratings/ciena-stock-rating-downgraded-to-neutral-from-buy-by-bofa-securities-93CH-4454659)
[3] Fusion Worldwide - “How Hyperscaler Spending Influences Semiconductor Supply Chains” (https://www.fusionww.com/insights/resources/the-cost-of-ai-how-hyperscaler-spending-is-impacting-semiconductor-supply)
[4] Goldman Sachs - “Why AI Companies May Invest More than $500 Billion in 2026” (https://www.goldmansachs.com/insights/articles/why-ai-companies-may-invest-more-than-500-billion-in-2026)
[5] Mordor Intelligence - Optical Networking and Communications Market Analysis (https://www.mordorintelligence.com)
[6] Technical and Financial Analysis - Retrieved from Financial Database (2026-01-20)
[7] Yahoo Finance - “Ciena (CIEN) Is Down 6.3% After AI-Focused Q4 Beat Highlights” (https://finance.yahoo.com/news/ciena-cien-down-6-3-190947586.html)
[8] Sector Performance Data - Retrieved from Financial Database (2026-01-20)
数据基于历史,不代表未来趋势;仅供投资者参考,不构成投资建议
关于我们:Ginlix AI 是由真实数据驱动的 AI 投资助手,将先进的人工智能与专业金融数据库相结合,提供可验证的、基于事实的答案。请使用下方的聊天框提出任何金融问题。