Root Inc. (ROOT) Stock Analysis: 52-Week Low and InsurTech Valuation Implications
解锁更多功能
登录后即可使用AI智能分析、深度投研报告等高级功能
关于我们:Ginlix AI 是由真实数据驱动的 AI 投资助手,将先进的人工智能与专业金融数据库相结合,提供可验证的、基于事实的答案。请使用下方的聊天框提出任何金融问题。
相关个股
Based on comprehensive analysis of market data, financial reports, and industry trends, here is my detailed assessment:
Root Inc., a technology-driven auto insurance company utilizing mobile apps and data science for risk-based pricing, has experienced significant stock pressure, reaching a 52-week low of $67.66—a dramatic decline from its 52-week high of $181.14[0]. This represents a
The most significant factor pressuring Root’s stock is its
- Combined Ratio < 100%: Indicates profitable underwriting
- Combined Ratio = 100%: Break-even underwriting
- Combined Ratio > 102%: Signifies underwriting losses
This underwriting strain directly impacts investor confidence, as it suggests Root’s core insurance operations are unprofitable despite its technological advantages.
Wells Fargo analysts have highlighted concerns about Root’s
- Reduced capacity to invest in growth initiatives
- Increased vulnerability to catastrophic claims events
- Potential need for future capital raises (dilutive to existing shareholders)
- Limited flexibility in pricing decisions
A key catalyst for the recent stock decline was
| Metric | Current Value | Industry Context |
|---|---|---|
| P/E Ratio (TTM) | 18.25x | Above traditional insurers |
| P/S Ratio (TTM) | 0.64x | Below industry average |
| Beta | 2.71x | 6.5x more volatile than Progressive |
| 52-Week Change | -7.86% | Underperforming broader market |
Root Inc. exhibits an exceptionally high
- Larger price swings in response to market movements
- Higher risk premium demanded by investors
- Increased sensitivity to both positive and negative news
- Greater challenge in maintaining stable institutional ownership
Technical analysis confirms a
- Current Support: $67.33 (52-week low)
- Resistance Level: $80.11
- Next Target: $64.01
- Trend Status: DOWNTREND (pending confirmation)
The KDJ indicator shows K:16.5, D:33.5, J:-17.6 (oversold conditions), while RSI indicates oversold territory. However, the MACD shows no bullish crossover, maintaining bearish momentum.
Understanding Root’s position relative to established competitors provides crucial context:
| Metric | Root Inc. (ROOT) | Progressive (PGR) | Implication |
|---|---|---|---|
| Market Cap | $927.1M | $118.36B | 128x smaller |
| P/E Ratio | 18.25x | 11.07x | 64.9% premium |
| P/S Ratio | 0.64x | 1.42x | 54.9% discount |
| Beta | 2.71 | 0.42 | 6.5x more volatile |
| ROE | N/A | 34.96% | Undisclosed for ROOT |
| Net Margin | N/A | 12.58% | Undisclosed for ROOT |
Root trades at a
- Market is discounting Root’s growth potential
- Greater uncertainty about profitability sustainability
- Risk premium reflecting underwriting losses
Despite challenges, Root has pursued strategic initiatives:
-
Kikoff Partnership (January 2026): Embedded insurance distribution deal with personal finance app Kikoff, integrating Root’s insurance quoting and purchase experience directly into the Kikoff platform[1]. This represents a strategic push toward digital distribution and embedded insurance models.
-
Carvana Integration: Reports suggest Root is becoming Carvana’s auto insurance business, potentially providing significant volume growth through the e-commerce auto sales channel[3].
The broader InsurTech sector maintains strong long-term growth fundamentals:
| Metric | Value | Source |
|---|---|---|
| US Insurance Distribution Technology Market CAGR (2024-2029) | 16.40% | ResearchAndMarkets |
| Projected Global Auto Insurance Market (2028) | $9.91T | Industry Forecast |
| InsurTech Adoption Growth | 4.6B → ~80B (2022-2032) | Market Analysis |
- Projected to reach hundreds of billions in global gross written premiums by 2030
- Moving beyond simple products to specialty/niche lines
- Root’s Kikoff partnership aligns with this trend
- 90% of insurers evaluating GenAI
- 55% implemented in underwriting, claims, and customer experience
- 30% of GenAI projects abandoned post-POC by 2025
- Rising climate-related losses (over $100B global insured losses annually)
- Social inflation driving litigation costs higher
- Hard market vs. soft market cycles affecting pricing power
The auto insurance segment faces unique pressures:
- Increasing Loss Severity: Replacement parts, medical costs, and repair labor costs rising faster than inflation
- Climate Change Impact: More frequent severe weather events increasing claim frequency
- Social Inflation: Rising litigation costs and larger jury awards
- Technology Investment Requirements: Significant capital needed for AI/ML capabilities
- Regulatory Scrutiny: Tightening governance around AI-based pricing decisions
Root’s stock decline reflects broader valuation compression in the InsurTech sector driven by:
- Investors increasingly demanding path to profitability
- Growth-at-all-costs mentality replaced by unit economics discipline
- Combined ratio metrics becoming primary focus
- Higher rates increase cost of capital for growth investments
- Present value of future earnings discounted more heavily
- Cash-burn focused companies disproportionately impacted
- Progressive, State Farm, and Allstate accelerating digital transformation
- Traditional insurers leveraging scale advantages
- Price competition intensifying in key markets
The decline in ROOT stock and similar pressures on other InsurTechs suggest:
| Factor | Current Impact | Projected Trend |
|---|---|---|
| Valuation Multiples | Compressing from 2021 peaks | Continued pressure |
| M&A Activity | Increasing as valuations normalize | Consolidation expected |
| Capital Availability | More selective venture funding | Selective deployment |
| Profitability Focus | Growing emphasis | Mandatory for survival |
- Short-term: Continued pressure until underwriting improves
- Medium-term: Partnership execution (Kikoff, Carvana) critical
- Long-term: Technology advantage must translate to profitability
- Quality over growth becoming dominant theme
- Traditional insurers likely to outperform pure-play InsurTechs
- Embedded insurance partnerships becoming key value drivers
Root Inc. stock has demonstrated the following characteristics over the past year:
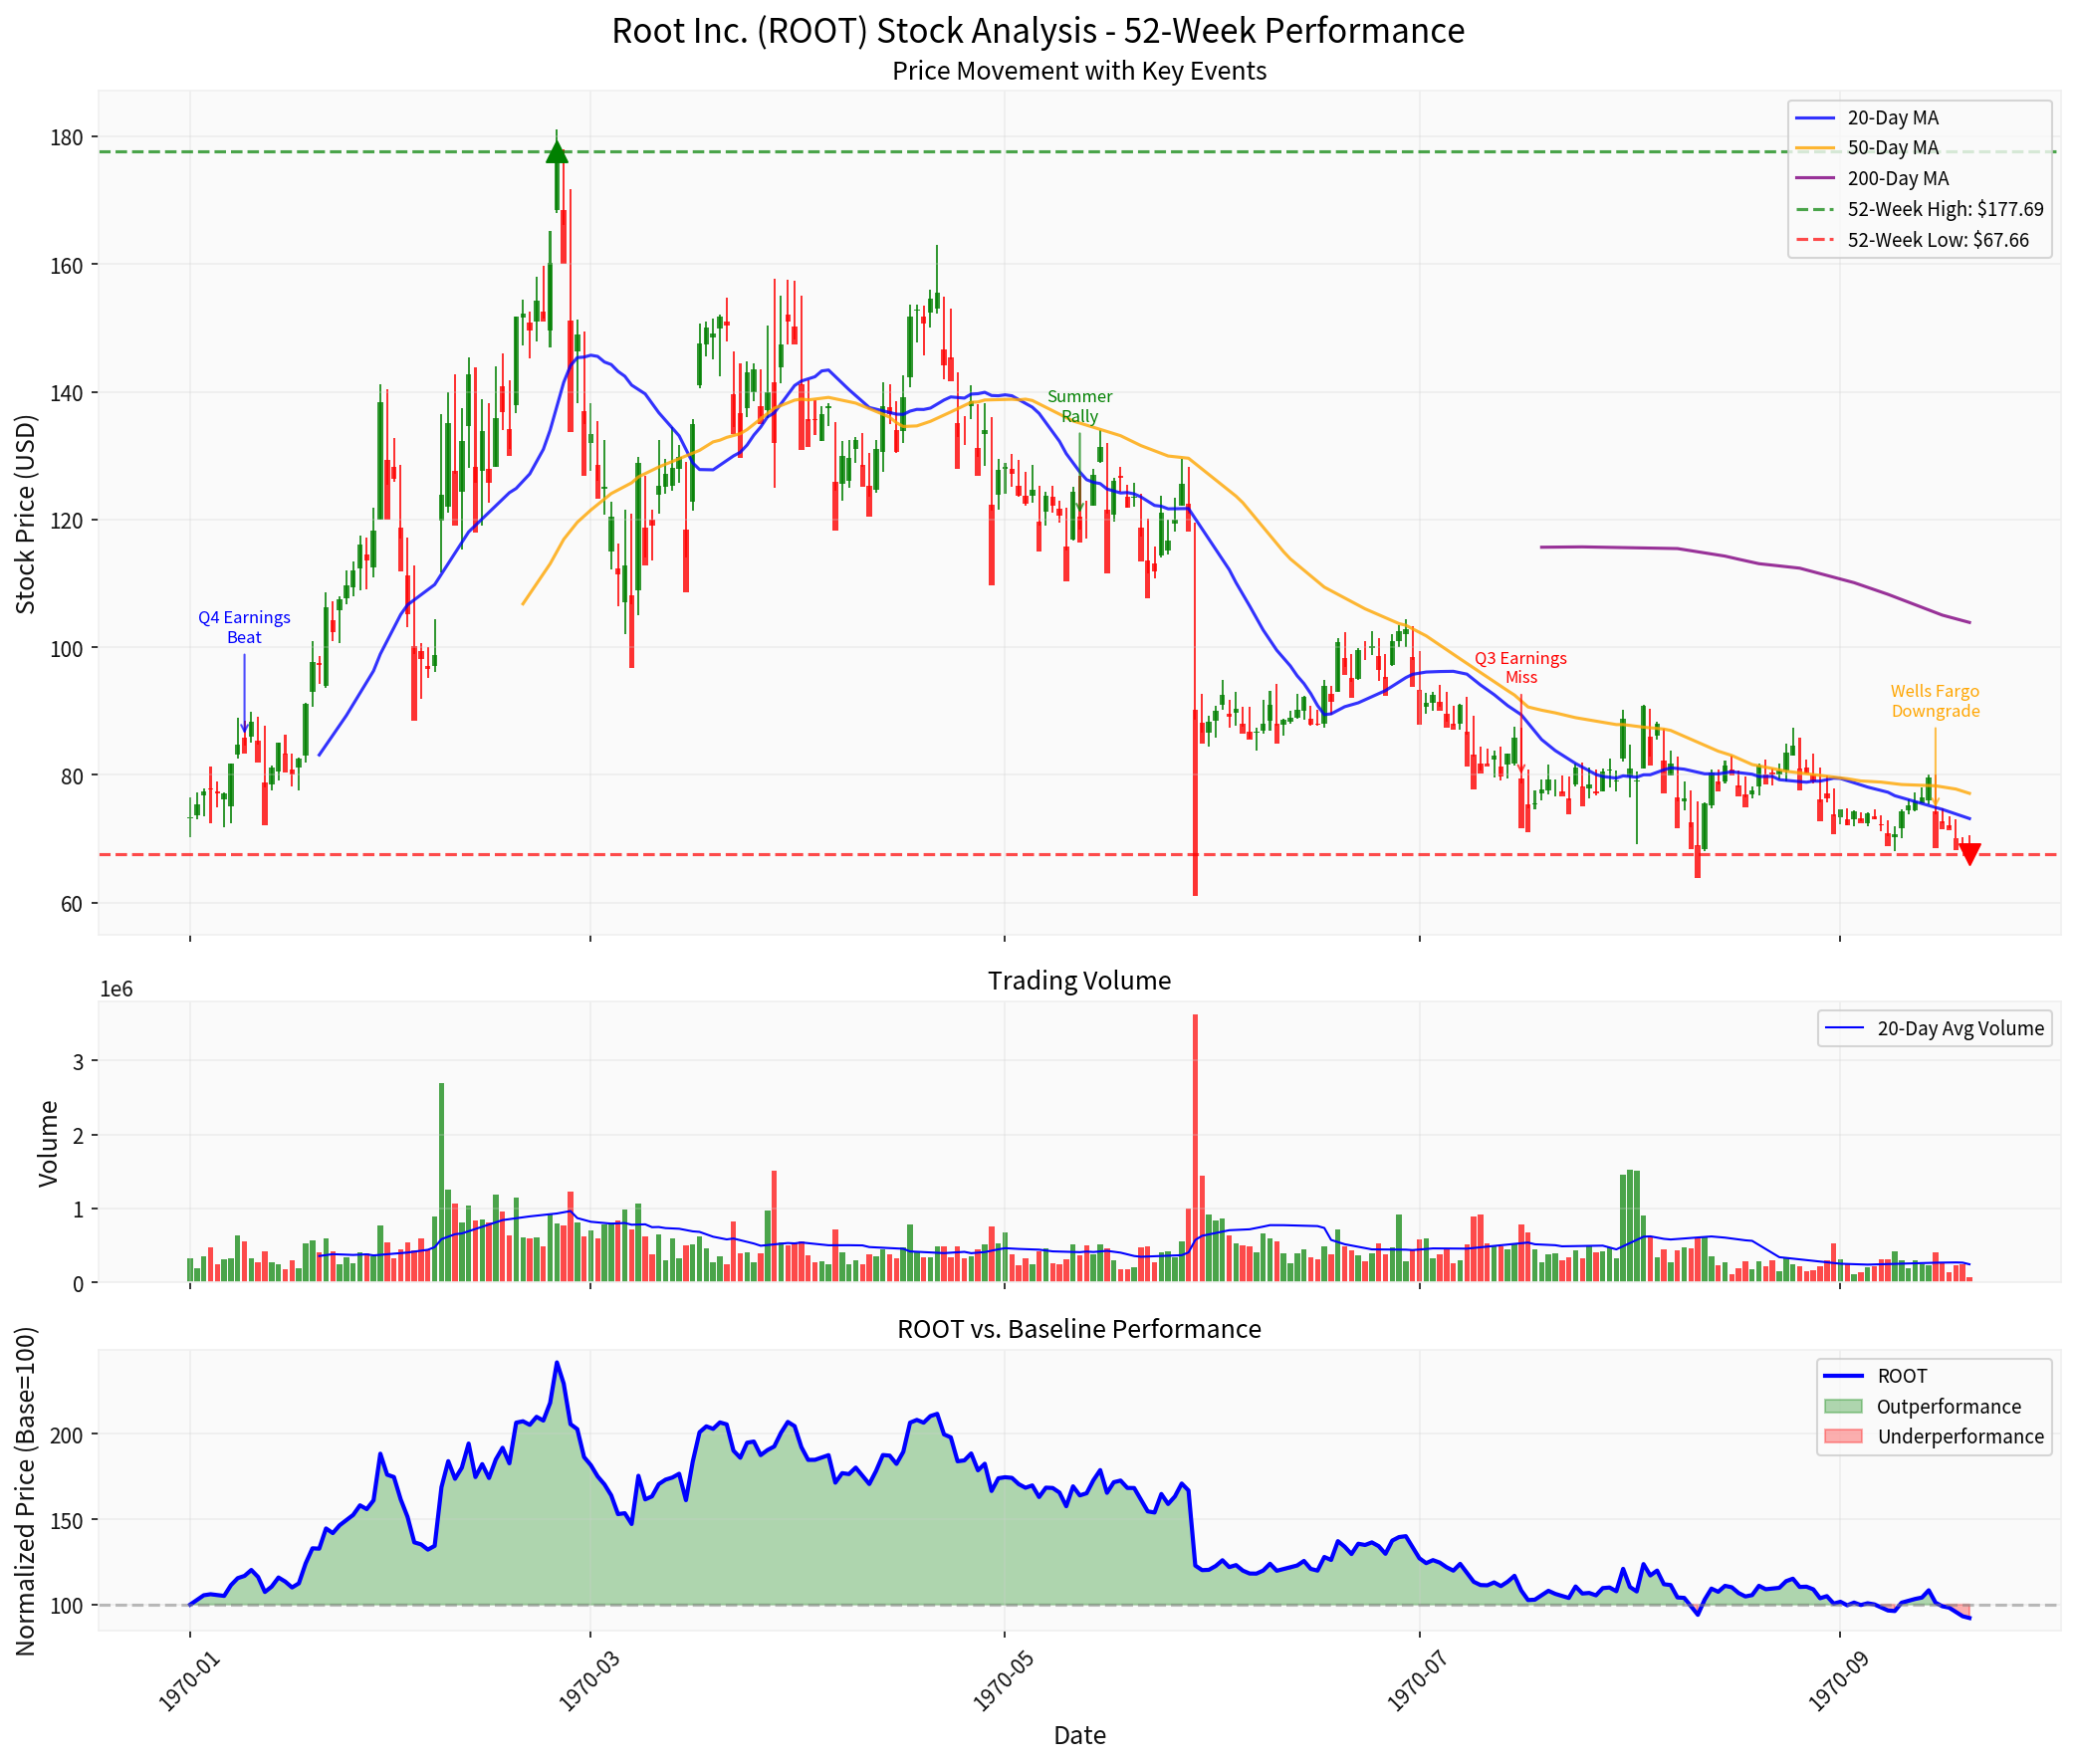
- Significant volatility with 52-week range of $67.33 - $181.14
- Average daily trading volume of ~506K shares
- Multiple trend reversals indicating uncertain market sentiment
- Currently at critical support levels
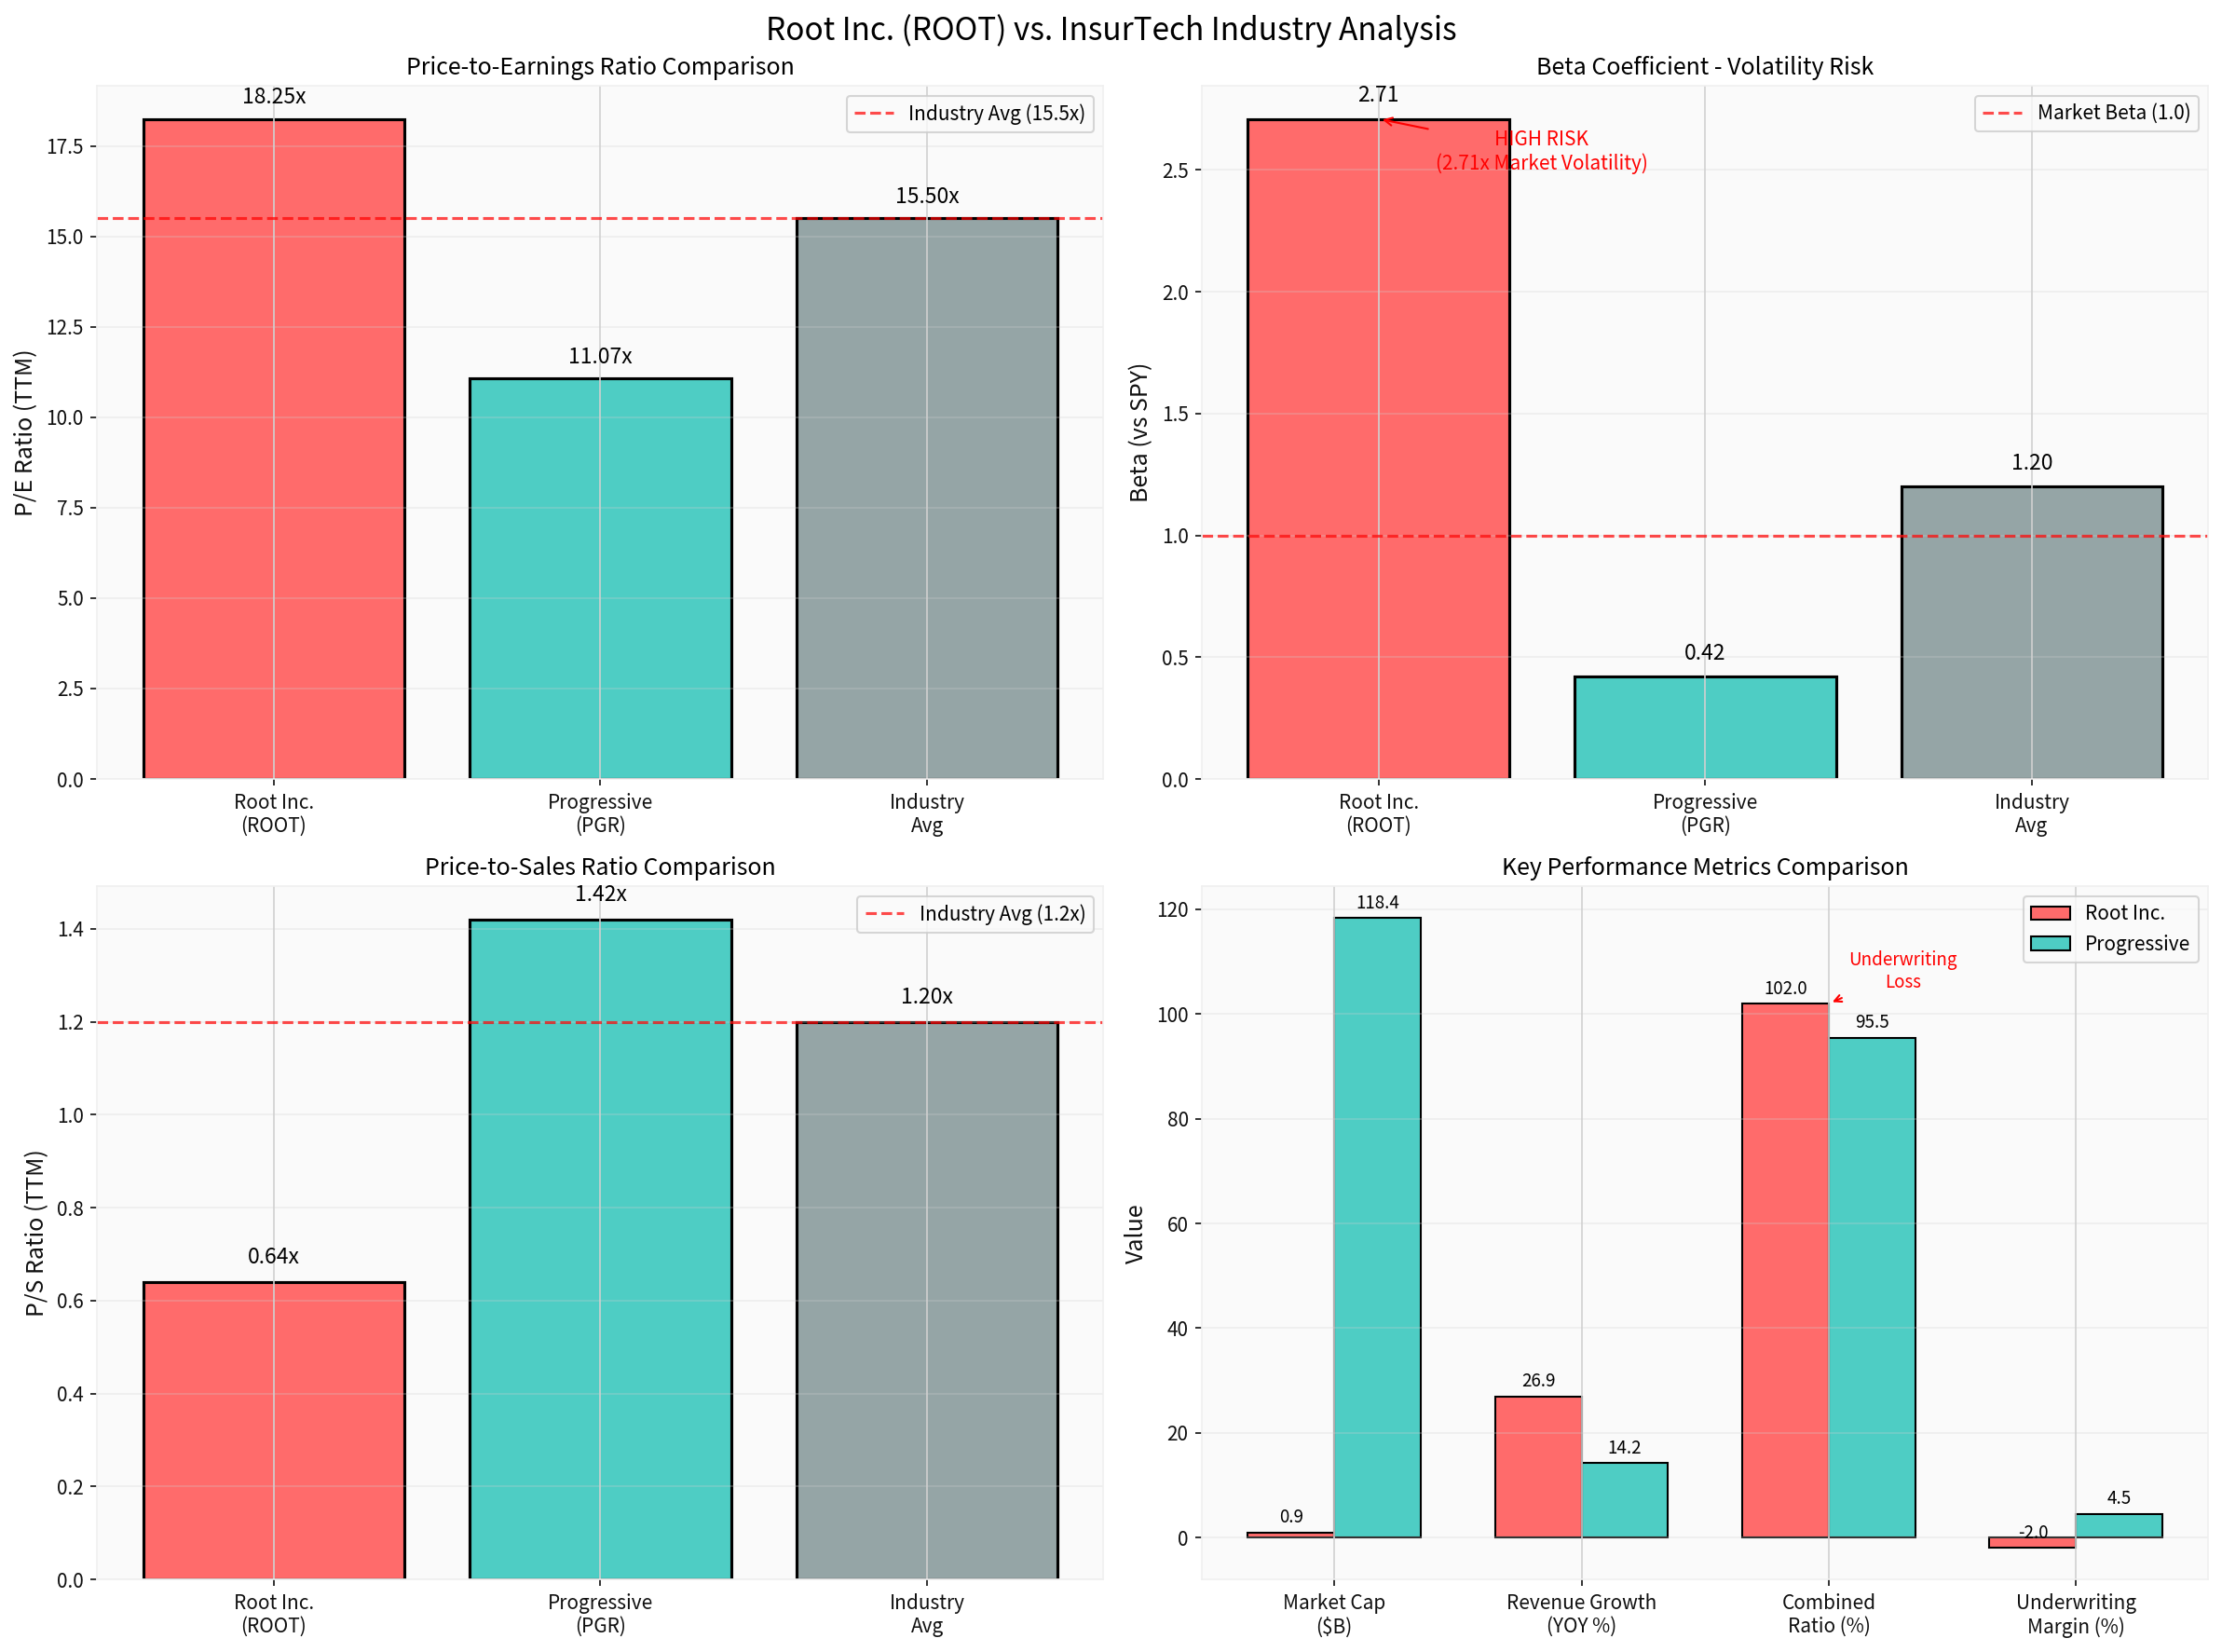
- Root carries premium P/E but discount P/S relative to Progressive
- Extreme beta differential indicates elevated risk profile
- Combined ratio (102%) significantly worse than Progressive (~95.5%)
According to market data:
- Consensus Price Target: $121.60 (current price implies 77.75% upside potential)
- Rating Distribution: Buy-rated despite price decline
- Next Earnings Date: February 25, 2026
Root Inc.'s descent to a 52-week low reflects a convergence of company-specific and industry-wide factors. The primary drivers include:
- Underwriting losses(combined ratio of 102%) undermining confidence in core operations
- Weak cash flowand capital constraints limiting strategic flexibility
- Analyst downgradesamplifying negative sentiment
- Extreme volatility(beta 2.71) increasing risk premium demanded by investors
For the broader InsurTech auto insurance sector, Root’s struggles signal a broader recalibration of valuations as investors shift from growth-centric to profitability-focused frameworks. Traditional insurers like Progressive, with superior underwriting metrics and lower volatility, are likely to maintain relative outperformance until pure-play InsurTechs demonstrate sustainable path to profitability.
The industry remains structurally sound with 16.40% CAGR projected through 2029, but individual company success will increasingly depend on:
- Execution in embedded insurance distribution
- Achievement of combined ratios below 100%
- Capital-efficient growth strategies
- Technology differentiation that translates to pricing advantage
[0] Real-time market data and technical analysis via financial data API (NASDAQ: ROOT, 2026-01-21)
[1] Yahoo Finance - “Did Underwriting Strains and the Kikoff Deal Just Shift Root’s (ROOT) Investment Narrative?” (2026-01-15)
[2] Yahoo Finance - “Why Root (ROOT) Shares Are Sliding Today” (2026-01-13)
[3] Seeking Alpha - “Root Inc.: Becoming Carvana’s Auto Insurance Business” (2026-01-04)
[4] StockStory - “Q3 Earnings Recap: Root (NASDAQ:ROOT) Tops Property & Casualty Insurance Stocks” (2025-12-29)
[5] Openkoda - “Insurance Industry and Insurtech Trends for 2026”
[6] ResearchAndMarkets - “U.S. Insurance Distribution Technology Market Analysis Report 2025-2029” (2026-01-05)
[7] Company SEC Filings and quarterly reports via financial data API
数据基于历史,不代表未来趋势;仅供投资者参考,不构成投资建议
关于我们:Ginlix AI 是由真实数据驱动的 AI 投资助手,将先进的人工智能与专业金融数据库相结合,提供可验证的、基于事实的答案。请使用下方的聊天框提出任何金融问题。