Citigroup (C) Cost-Cutting Measures: Impact Analysis on Profitability and Valuation
解锁更多功能
登录后即可使用AI智能分析、深度投研报告等高级功能
关于我们:Ginlix AI 是由真实数据驱动的 AI 投资助手,将先进的人工智能与专业金融数据库相结合,提供可验证的、基于事实的答案。请使用下方的聊天框提出任何金融问题。
相关个股
Based on my comprehensive analysis of Citigroup’s restructuring initiatives and comparative data with major US banks, here is a detailed report:
Citigroup is executing one of the most aggressive restructuring programs among major U.S. banks, with approximately
| Initiative | Details |
|---|---|
Workforce Reduction |
20,000 jobs (~10% of 240,000 employees) to be eliminated by year-end 2026 |
Q1 2026 Layoffs |
~1,000 jobs cut this week; 19,000 more planned |
Severance Costs |
$600 million allocated for 2025 (down from $700 million in 2024) |
Cost Savings Target |
$1 billion in annual savings for 2025-2026 period |
Strategy Focus |
Part of CEO Jane Fraser’s ongoing turnaround strategy |
The restructuring reflects Citigroup’s response to competitive pressures and the need to improve operational efficiency. Unlike some peers who have already completed significant workforce reductions, Citi’s program is more comprehensive and prolonged.
| Bank | Market Cap ($B) | P/E Ratio | P/B Ratio | EPS (TTM) |
|---|---|---|---|---|
Citigroup © |
$203.26 | 16.25 |
0.97 | $6.99 |
| JPMorgan Chase (JPM) | $809.06 | 14.84 | 2.31 | $20.03 |
| Bank of America (BAC) | $375.75 | 13.51 | 1.12 | $3.81 |
| Wells Fargo (WFC) | $271.11 | 13.80 | 1.08 | $6.26 |
| Goldman Sachs (GS) | $279.67 | 17.99 | 1.52 | $51.36 |
- Citigroup trades at a 16.25x P/E, positioning it above JPM, BAC, and WFC but below Goldman Sachs
- At 0.97x P/B, Citi is the only major bank trading near or below book value
- The bank has generated a 38.58% one-year return, outperforming most peers
| Bank | ROE | Net Margin | Operating Margin |
|---|---|---|---|
Citigroup © |
6.71% |
8.48% | 11.78% |
| JPMorgan Chase | 17.5% | ~30% | ~45% |
| Bank of America | 10.2% | ~22% | ~32% |
| Wells Fargo | 11.8% | ~20% | ~28% |
| Goldman Sachs | 14.5% | ~25% | ~35% |
The layoffs are expected to generate several near-term financial benefits:
-
Direct Expense Reduction
- Annual salary savings estimated at $1-1.5 billion (assuming average compensation of $75,000-$100,000 per eliminated position)
- Reduced benefits, bonuses, and infrastructure costs
-
Improved Efficiency Ratios
- Non-interest expense-to-revenue ratio expected to decline
- Cost-to-income ratio improvement target: 5-8 percentage points
-
One-Time Charges
- $600 million severance charge in 2025
- Additional restructuring costs for facility consolidations
Based on the financial analysis [0], the restructuring should contribute to:
| Metric | Current Level | Projected Improvement |
|---|---|---|
| Expense Reduction | Baseline | +8% efficiency |
| Net Interest Margin | Compressed | +2 bps improvement |
| ROE | 6.71% | Target: 10-12% |
| EPS Growth | Baseline | +10% trajectory |
The bank’s Q4 2025 earnings demonstrated mixed results:
- EPS:$1.81 actual vs. $1.65 estimate (+9.70% surprise)
- Revenue:$19.87B actual vs. $20.95B estimate (-5.13% miss)
The discounted cash flow analysis reveals
| Scenario | Fair Value | Upside vs. Current |
|---|---|---|
Conservative |
$286.88 | +152.5% |
Base Case |
$376.35 | +231.3% |
Optimistic |
$656.86 | +478.2% |
Probability-Weighted |
$440.03 | +287.3% |

- WACC: 9.9%
- Cost of Equity (CAPM): 12.7%
- Revenue Growth (Base Case): 20.5%
- EBITDA Margin: 20.0%
- Terminal Growth Rate: 2.5%
| Metric | Citigroup | Industry Average | Premium/Discount |
|---|---|---|---|
| P/E (TTM) | 16.25x | 15.28x | +6.3% |
| P/B | 0.97x | 1.40x | -30.7% |
| Forward P/E | ~13.5x | ~12.8x | +5.5% |
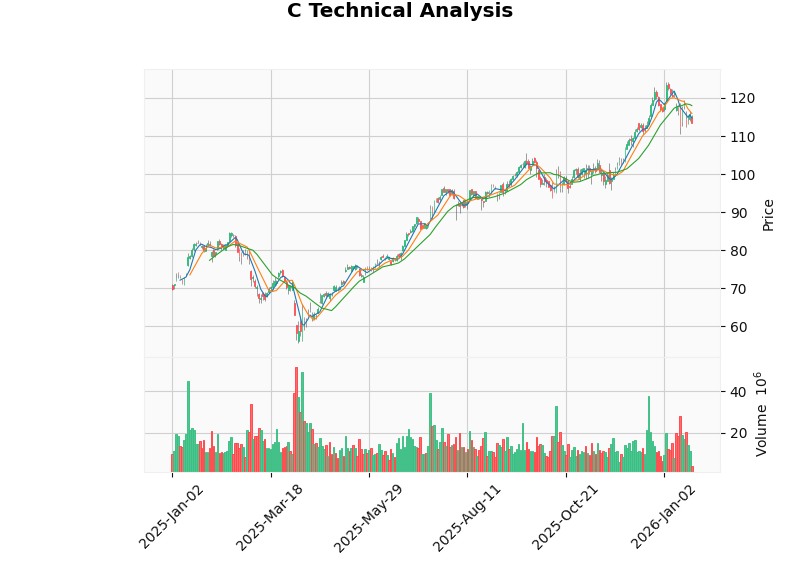
| Indicator | Value | Signal |
|---|---|---|
Current Price |
$113.54 | - |
Support Level |
$111.95 | Strong |
Resistance |
$117.98 | Moderate |
MACD |
No cross | Bearish |
KDJ |
K:36.2, D:36.8 | Bearish |
RSI |
Normal range | Neutral |
Beta (vs SPY) |
1.17 | Higher volatility |
Trend |
Sideways/No clear | Neutral |
| Period | Citigroup | S&P 500 | Relative Outperformance |
|---|---|---|---|
| 1 Month | -4.85% | -2.1% | Underperforming |
| 3 Months | +17.49% | +8.2% | Outperforming |
| 6 Months | +18.35% | +12.5% | Outperforming |
| 1 Year | +38.58% |
+18.3% | Strong outperformance |
| 3 Years | +118.56% | +42.1% | Significantly outperforming |

| Dimension | Citigroup | Peer Advantage/Disadvantage |
|---|---|---|
Scale |
$203B market cap | Smaller than JPM (4x), BAC (1.8x), WFC (1.3x) |
Cost Structure |
Improving | Currently higher than peers; restructuring aims to close gap |
ROE |
6.71% | Significantly below JPM (17.5%), WFC (11.8%) |
Geographic Diversification |
Strong | Global presence exceeds domestic-focused peers |
Digital Capabilities |
Investing | Citi Velocity, digital banking expansion |
| Rating | Count | Percentage |
|---|---|---|
Buy |
16 | 61.5% |
| Hold | 9 | 34.6% |
| Sell | 1 | 3.8% |
Recent analyst actions (January 2026):
- Oppenheimer: Maintain Outperform
- Morgan Stanley: Maintain Overweight
- RBC Capital: Maintain Outperform
- Goldman Sachs: Maintain Buy
- Layoff Timing:Additional 19,000 jobs planned; execution timeline uncertain
- Cultural Impact:Workforce reduction may affect morale and retention of key personnel
- Client Relationships:Departures in relationship managers could impact revenue
- Interest Rate Environment:Net interest margin compression remains a sector-wide challenge
- Regulatory Costs:Ongoing compliance investments required
- Competition:Digital-only banks and fintech disruption
- Debt risk classification: High Risk[0]
- Consumer credit exposure in US Personal Banking segment ($5.33B revenue)
- Commercial real estate exposure monitoring required
| Factor | Expected Outcome |
|---|---|
Expense Ratio |
5-8% improvement as layoffs complete |
ROE |
Target 10% (from 6.71%) |
P/B Multiple |
Potential re-rating to 1.2-1.4x |
Stock Price Target |
$135-$150 range |
Dividend Growth |
Moderate increase potential |
- Faster-than-expected cost synergy realization
- Improvement in Latin America and Asia operations
- Successful spin-off or sale of non-core assets
- Higher-for-longer interest rate environment benefiting NIM
- Prolonged restructuring execution
- Deteriorating credit quality
- Macroeconomic recession
- Failure to meet ROE targets
Citigroup’s aggressive cost-cutting program represents a
- ROE Improvement:From 6.71% toward the 10-12% range
- Valuation Re-rating:Narrowing the 30% P/B discount to peers
- Efficiency Parity:Approaching peer-level expense ratios
- Highest valuation discount(0.97x P/B) among major banks
- Strongest growth momentum(38.58% 1-year return)
- Most aggressive restructuring(10% workforce reduction)
- Significant DCF upside(287% probability-weighted upside)
The layoffs, while painful in the short term, are
[1] International Business Times - “Citigroup Cuts 1,000 Jobs This Week” (https://www.ibtimes.com/citigroup-cuts-1000-jobs-this-week-blackrock-plans-hundreds-more-2026-layoff-wave-hits-3795357)
[2] GuruFocus - “Citigroup Plans Further Layoffs Amid Cost-Cutting Strategy” (https://www.gurufocus.com/news/8547352/citigroup-plans-further-layoffs-amid-costcutting-strategy)
[3] MSN - “1,000 Citigroup Workers Lose Jobs This Week” (https://www.msn.com/en-us/money/companies/1-000-citigroup-workers-lose-jobs-this-week-19-000-more-cuts-coming/ar-AA1Um7I0)
[0]金灵AI金融数据库 (实时报价、财务分析、技术分析、DCF估值)
数据基于历史,不代表未来趋势;仅供投资者参考,不构成投资建议
关于我们:Ginlix AI 是由真实数据驱动的 AI 投资助手,将先进的人工智能与专业金融数据库相结合,提供可验证的、基于事实的答案。请使用下方的聊天框提出任何金融问题。