Airbus vs Boeing: Trade-Related Risks and Supply Chain Challenges Analysis
解锁更多功能
登录后即可使用AI智能分析、深度投研报告等高级功能

关于我们:Ginlix AI 是由真实数据驱动的 AI 投资助手,将先进的人工智能与专业金融数据库相结合,提供可验证的、基于事实的答案。请使用下方的聊天框提出任何金融问题。
相关个股
Now let me compile a comprehensive analysis based on all the gathered data.
The global aerospace industry faces significant headwinds from escalating trade tensions, supply chain disruptions, and geopolitical uncertainties. Airbus has issued prominent warnings about trade-related damage, while Boeing continues to navigate its own operational challenges. This analysis examines how these factors impact sector valuations and competitive positioning between the duopoly’s two major players[0].
| Metric | Boeing (BA) | Airbus (EADSY) |
|---|---|---|
Current Price |
$252.15 | $61.37 |
Market Cap |
$197.45B | $193.81B |
1-Year Return |
+43.93% | +41.20% |
YTD Return |
+10.70% | +2.90% |
1-Month Return |
+16.50% | +5.79% |
6-Month Return |
+8.19% | +15.70% |
| Metric | Boeing | Airbus | Implication |
|---|---|---|---|
Net Profit Margin |
-12.20% | +7.02% | Airbus demonstrates superior profitability |
Operating Margin |
-10.37% | +7.82% | Airbus maintains operational efficiency |
ROE |
2.10% | 22.04% | Airbus generates significantly better returns on equity |
P/E Ratio |
N/A (negative) | 32.23x | Boeing not currently profitable; Airbus trades at premium |
- Boeing:Classified as “aggressive” in accounting practices, with low depreciation/capex ratios suggesting potential earnings quality concerns[0]
- Airbus:Maintains “neutral” accounting practices without persistent extremes[0]
- Boeing:Free Cash Flow of -$14.4B, indicating significant cash consumption[0]
- Airbus:Positive Free Cash Flow of $3.7B, demonstrating better cash generation[0]
| Company | Beta (vs SPY) | Interpretation |
|---|---|---|
Boeing |
1.16 | More volatile than market; higher systematic risk |
Airbus |
0.94 | Lower volatility than market; more defensive positioning |
Airbus CEO has warned of “significant” damage from trade摩擦 (trade frictions), highlighting several key risk factors:
- Tariff Exposure:As a European-based manufacturer with global supply chains, Airbus faces potential tariff escalations across multiple jurisdictions
- Titanium Dependency:Major reliance on Russian titanium supplies (pre-Ukraine conflict) has necessitated supply chain restructuring
- Chinese Market Access:Potential retaliatory tariffs could impact Airbus’s significant order book from Chinese airlines
- U.S. Trade Policy:Export controls and potential tariffs on aerospace components affect both manufacturers
Boeing faces distinct but equally significant supply chain vulnerabilities:
- Supplier Concentration Risk:Heavy reliance on Spirit AeroSystems and other key suppliers
- Quality Control Issues:Recent quality concerns have led to production delays and inspection requirements
- Regulatory Scrutiny:Increased oversight may slow production and increase compliance costs
- Labor Disputes:Ongoing labor negotiations could impact production schedules
- Commercial Airplanes: $11.09B (47.5%)
- Defense, Space & Security: $6.90B (29.5%)
- Global Services: $5.37B (23.0%)[0]
- EPS beat estimates by +13.89% ($0.41 actual vs $0.36 estimate)
- Revenue missed expectations by -21.58% ($20.88B vs $26.62B estimate)[0]
| Company | Consensus Rating | Price Target | Upside/Downside |
|---|---|---|---|
Boeing |
BUY (65.4% Buy) | $263.50 | +4.5% |
Airbus |
BUY (66.7% Buy) | $51.00 | -16.9% |
The broader Industrials sector has shown modest weakness, declining -0.34% recently[0]. Within this context:
- Basic Materials(+1.73%) leads sector performance
- Aerospace & Defensecompanies face headwinds from potential defense spending cuts
- Supply Chain Intensivecompanies are particularly vulnerable to tariff escalations
Recent market data shows:
- S&P 500: Trading around 6,915-6,977 range with mixed performance
- Dow Jones Industrial: ~49,000-49,600 range with volatility[0]
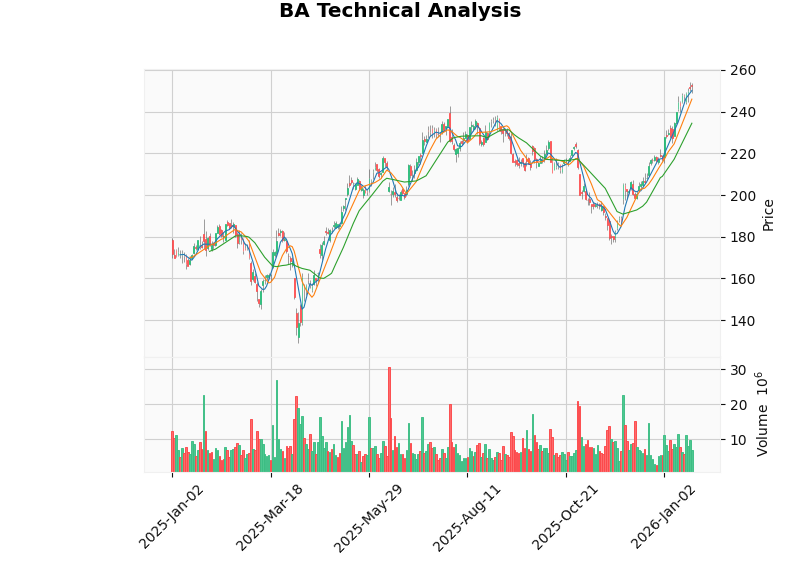
| Indicator | Value | Signal |
|---|---|---|
MACD |
No cross | Bullish |
KDJ |
K:91.9, D:92.2, J:91.3 | Bearish (overbought) |
RSI |
Overbought territory | Risk signals |
20-Day MA |
$234.41 | Support level |
50-Day MA |
$212.30 | Rising trend |
Trend |
Sideways | No clear direction |
- Support: $234.41
- Resistance: $254.83[0]
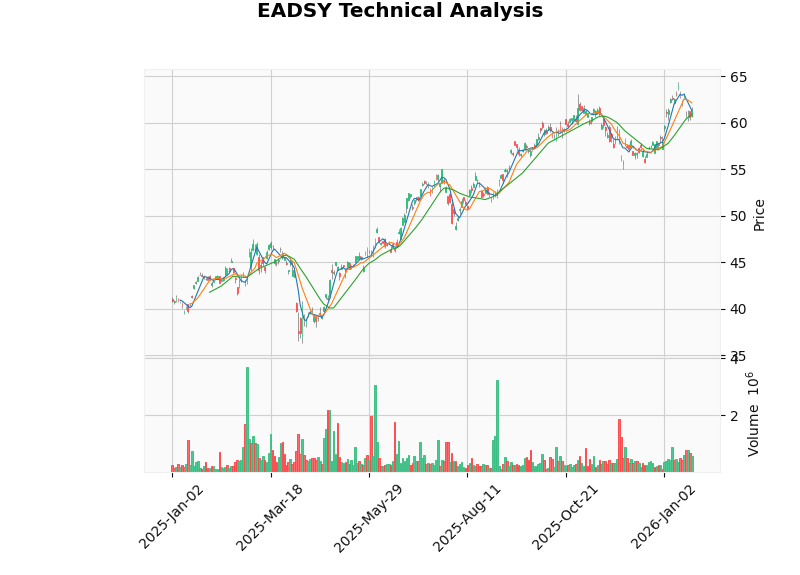
| Indicator | Value | Signal |
|---|---|---|
MACD |
No cross | Bearish |
KDJ |
K:28.3, D:41.9, J:1.2 | Bearish (oversold potential) |
RSI |
Normal range | Neutral |
20-Day MA |
$60.89 | Near current price |
50-Day MA |
$59.11 | Support level |
Trend |
Sideways | Consolidation |
- Support: $60.77
- Resistance: $61.97[0]
- Negative P/E ratio indicates current unprofitability
- High beta (1.16) amplifies market risk exposure
- Aggressive accounting may mask underlying issues
- Premium valuation ($252.15) despite losses creates risk
- P/E of 32.23x may be elevated relative to growth prospects
- Trading -16.9% below analyst targets suggests potential correction
- Moderate debt risk classification requires monitoring
- Lower beta provides defensive characteristics
| Factor | Boeing Impact | Airbus Impact | Net Effect |
|---|---|---|---|
Tariff Increases |
High (U.S. exposure) | High (EU exposure) | Both negative |
Currency Volatility |
Moderate | High (Euro weakness) | Airbus more vulnerable |
Component Costs |
High (quality-related) | Moderate | Boeing more affected |
Supplier Diversification |
Improving | Established | Airbus advantage |
- Monitor upcoming Q4 FY2025 earnings (January 27, 2026) for operational improvements
- Watch for progress on supply chain restructuring and quality initiatives
- Defense segment provides stability amid commercial aerospace challenges
- Technical overbought conditions suggest caution near $254.83 resistance
- Trade policy developments remain critical risk factor
- Strong profitability provides buffer against cost pressures
- Current price above analyst targets suggests limited upside
- Technical oversold conditions in KDJ indicator may signal opportunity
- Geopolitical Escalation:Further trade tensions could impact both manufacturers’ global operations
- Supply Chain Reconfiguration:Costs of diversifying suppliers will pressure margins near-term
- Defense Spending Uncertainty:Potential government spending cuts could affect defense revenue streams
- Economic Slowdown:Airline capital expenditure reductions would impact aircraft orders
- Regulatory Environment:Increased scrutiny on safety and quality may slow production
Airbus’s warnings about trade-related damage reflect genuine risks facing the aerospace sector. The competitive positioning analysis reveals:
- Airbus holds structural advantagesin profitability, cash flow generation, and defensive positioning (lower beta)
- Boeing shows recovery momentumbut faces greater vulnerability to trade policy uncertainty given its higher beta and negative profitability
- Both companies face significant supply chain challenges, though Boeing’s recent quality issues compound its exposure
- Valuation differentialssuggest Airbus may be relatively overvalued while Boeing, despite its challenges, offers more clear upside potential
The trade-related risks and supply chain challenges are likely to:
- Pressure marginsacross the sector, particularly for companies with aggressive accounting
- Favor well-capitalized, profitable companieslike Airbus over struggling competitors
- Increase volatilityin aerospace valuations as policy developments unfold
- Accelerate supply chain restructuringwith short-term cost increases
Investors should monitor upcoming earnings reports, trade policy developments, and order book updates as key catalysts for valuation adjustments in this sector.
[0]金灵AI金融数据API - Market data, financial analysis, technical indicators, and company fundamentals for Boeing (BA) and Airbus (EADSY) as of January 25, 2026.
数据基于历史,不代表未来趋势;仅供投资者参考,不构成投资建议
关于我们:Ginlix AI 是由真实数据驱动的 AI 投资助手,将先进的人工智能与专业金融数据库相结合,提供可验证的、基于事实的答案。请使用下方的聊天框提出任何金融问题。