Brink's Company (BCO) Investment Analysis: All-Time Highs with 132% DCF Upside
解锁更多功能
登录后即可使用AI智能分析、深度投研报告等高级功能
关于我们:Ginlix AI 是由真实数据驱动的 AI 投资助手,将先进的人工智能与专业金融数据库相结合,提供可验证的、基于事实的答案。请使用下方的聊天框提出任何金融问题。
相关个股
Based on my comprehensive analysis, I can now provide you with a detailed assessment of Brink’s Company (BCO) stock reaching all-time highs and its valuation.
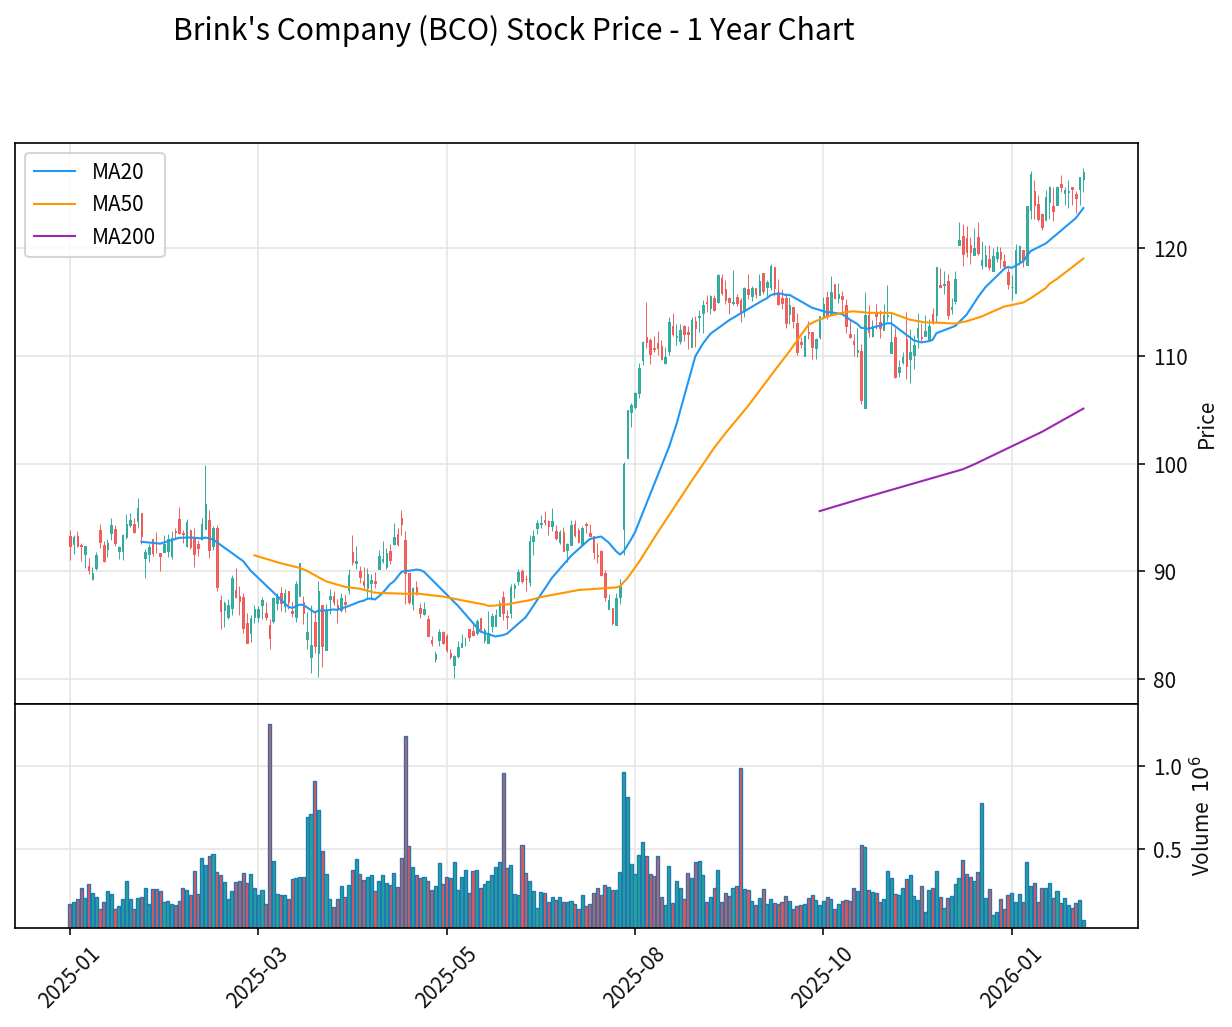
Brink’s Company shares have reached historic highs at
| Time Period | Return |
|---|---|
| 1 Month | +7.57% |
| 3 Months | +13.94% |
| 6 Months | +45.33% |
| 1 Year | +32.80% |
| 3 Years | +100.60% |
The stock is currently trading at its
Brink’s has demonstrated consistent earnings acceleration throughout 2025, with quarterly EPS growing from $1.62 (Q1) to $2.08 (Q3):
| Quarter | EPS | Revenue |
|---|---|---|
| Q1 FY2025 | $1.62 | $1.25B |
| Q2 FY2025 | $1.79 | $1.30B |
| Q3 FY2025 | $2.08 | $1.33B |
| Q4 FY2024 | $2.12 | $1.26B |
The company reported full-year 2024 revenue of
Annual revenue has shown consistent growth:
- 2022: $4.54 billion
- 2023: $4.87 billion (+7.3% YoY)
- 2024: $5.01 billion (+2.8% YoY) [0]
The company benefits from diversified revenue streams across three primary segments:
- North America: $434.8M (32.6%)
- Europe: $353.1M (26.4%)
- Latin America: $326.8M (24.5%)
- Rest of World: $220.3M (16.5%) [0]
Brink’s has successfully executed on its four strategic pillars:
- Partner for Customer Success– Focus on customer-centric service delivery
- Innovate to Grow– Technology-enabled solutions including DRS and AMS
- Run the Business Better– Operational excellence through the Brink’s Business System
- Win as Team Brink’s– Talent development and culture building [0]
The company’s Digital Retail Solutions (DRS) and ATM Managed Services (AMS) segment, representing
The company has been actively returning capital to shareholders through share buybacks:
- $500 million Share Repurchase Programcompleted in 2024
- Additional $203.6 millionspent on share repurchases in 2024 alone
- The reduced share count has amplified EPS growth [0]
Brink’s pays a dividend of approximately
| Metric | Value | Industry Comparison |
|---|---|---|
| P/E Ratio (TTM) | 31.36x | Elevated vs. Industrials average (~20x) |
| P/B Ratio | 19.87x | High |
| P/S Ratio | 1.03x | Reasonable |
| EV/OCF | 12.28x | Moderate |
The elevated P/E ratio of
| Scenario | Fair Value | Upside vs. Current |
|---|---|---|
Conservative |
$195.28 | +53.4% |
Base Case |
$262.43 | +106.1% |
Optimistic |
$431.73 | +239.1% |
Probability-Weighted |
$296.48 | +132.9% |
The DCF analysis indicates the current price of $127.32 represents significant discount to intrinsic value, with the probability-weighted fair value of
The base case scenario uses the following assumptions aligned with historical 5-year averages:
- Revenue Growth (CAGR): 7.9%
- EBITDA Margin: 13.7%
- WACC: 8.7%
- Terminal Growth: 2.5%[0]
Brink’s is a
- Brand Recognition: The BRINK’S name is a registered service mark globally recognized for security expertise
- Global Network: Controlling ownership interests in 51 countries with agency relationships in additional countries
- Security Expertise: 165+ years of experience since 1859 with rigorous security practices
- Technology Innovation: Proprietary solutions including Brink’s Complete™, CompuSafe®, iDeposit, and Daily Credit
- Logistics Excellence: Proven operational excellence and risk management expertise
- Financial Strength: High-quality insurance coverage and strong balance sheet [0]
Brink’s largest multinational competitors include:
- Loomis AB(Sweden)
- Prosegur, Compania de Seguridad, S.A.(Spain)
- Garda World Security Corporation(Canada) [0]
The company differentiates through service quality and value-added solutions rather than competing on price alone, targeting customers who prioritize security and reliability.
- Debt Risk: Classified as moderate risk with long-term debt of$3.6 billionand total liabilities of$6.3 billion[0]
- Interest Expense: Increased to$235.4 millionin 2024 from $203.8 million in 2023
- Economic Sensitivity: Revenues are affected by levels of economic activity and cash usage trends
- Currency Exposure: Significant foreign operations create currency translation risks (foreign currency translation loss of $556.7M) [0]
The technical analysis shows some cautionary signals:
- KDJ indicator: K=80.5, D=74.4, J=92.5 (overbought warning)
- Beta: 1.09 (slightly more volatile than the market)
- 20-Day Annualized Volatility: 26.03% [0]
| Rating | Count | Percentage |
|---|---|---|
Buy |
6 | 66.7% |
| Hold | 3 | 33.3% |
| Sell | 0 | 0% |
- Growth Momentum: Consistent earnings acceleration and revenue growth support premium valuation
- Market Position: Industry leader with strong competitive moats and global scale
- DCF Undervaluation: Probability-weighted fair value of $296 suggests significant upside
- Strategic Transformation: Successful shift toward technology-enabled services (DRS/AMS)
- Capital Return: Active share buybacks and dividends enhance shareholder value
- Premium Valuation: 31x P/E is elevated relative to historical norms and industry peers
- Technical Overbought: Short-term indicators suggest potential pullback
- Cash Usage Trends: Long-term shift toward digital payments could impact traditional CIT volumes
- Debt Load: Moderate debt risk requires continued attention to deleveraging
The current valuation, while elevated, appears
- Strong competitive position in a fragmented industry
- Accelerating earnings growth trajectory
- Successful business transformation toward higher-margin technology services
- Substantial DCF-derived upside potential
However, investors should be mindful of the overbought technical indicators and monitor the company’s ability to sustain growth as digital payment adoption continues to reshape the cash logistics industry.
[0] 金灵AI金融数据库 - 市场数据、财务分析、估值模型及SEC filing数据
[1] Yahoo Finance - “Brink’s or Loomis: Two Ways to Own the Persistence of Cash” (https://finance.yahoo.com/news/brinks-loomis-two-ways-own-103646491.html)
[2] SEC.gov - BCO Form 10-K Filing (https://www.sec.gov/Archives/edgar/data/78890/000007889025000059/bco-20241231.htm)
数据基于历史,不代表未来趋势;仅供投资者参考,不构成投资建议
关于我们:Ginlix AI 是由真实数据驱动的 AI 投资助手,将先进的人工智能与专业金融数据库相结合,提供可验证的、基于事实的答案。请使用下方的聊天框提出任何金融问题。